The pie chart shows the income distribution of four earning members of a family as a percentage of the total family income in the year 2016: If the in...
Question
The pie chart shows the income distribution of four earning members of a family as a percentage of the total family income in the year 2016:
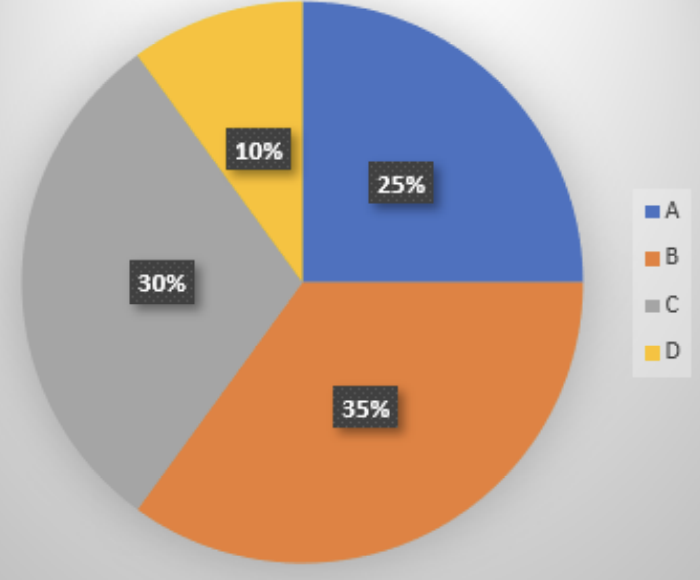
If the incomes of B and D increased by 20% and 40% respectively in the year 2017 compared to 2016, what is the ratio of the combined income of B and D in 2016 to their combined income in 2017?