The pie chart represents the income distribution among four earning members of a family in 2016 as follows: If the expenditures of A and B are equal, ...
Question
The pie chart represents the income distribution among four earning members of a family in 2016 as follows:
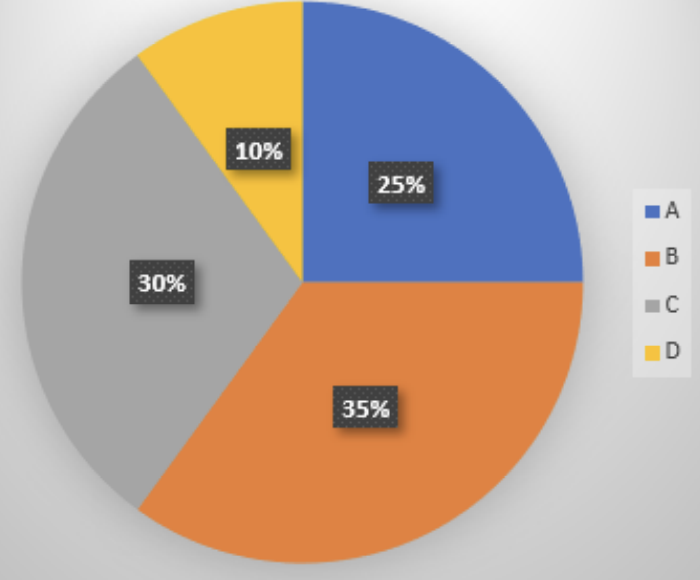
If the expenditures of A and B are equal, what is the difference between the savings of A and B expressed as a percentage of the income of D?