The pie chart represents the total number of goods (both sold and unsold) produced by four companies A, B, C, and D, with a total of 200 goods manufac...
Question
The pie chart represents the total number of goods (both sold and unsold) produced by four companies A, B, C, and D, with a total of 200 goods manufactured. The distribution is as follows: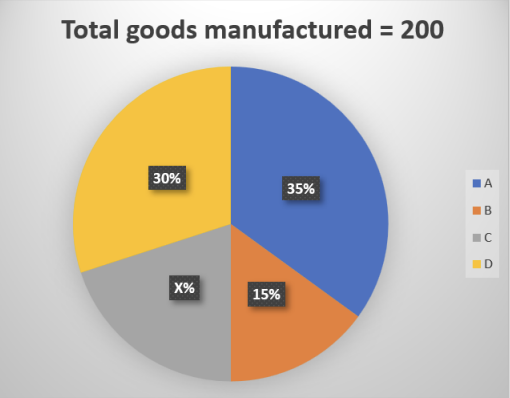
- Company A: 30%
- Company B: 35%
- Company C: 15%
- Company D: X%
The table below shows the percentage of goods sold by each company out of their total production:
| Company | Percentage of Goods Sold |
|---|---|
| A | 90\% |
| B | 80\% |
| C | 75\% |
| D | 4X\% |
Company E manufactures goods 33\frac{1}{3}% more than company D. Also, \frac{X}{2}% of goods produced by company E remain unsold.
Find the percentage of goods sold by company E relative to the unsold goods of company C.