The pie chart shows the income distribution of four earning members of a family as a percentage of the total family income in the year 2016: If the di...
Question
The pie chart shows the income distribution of four earning members of a family as a percentage of the total family income in the year 2016:
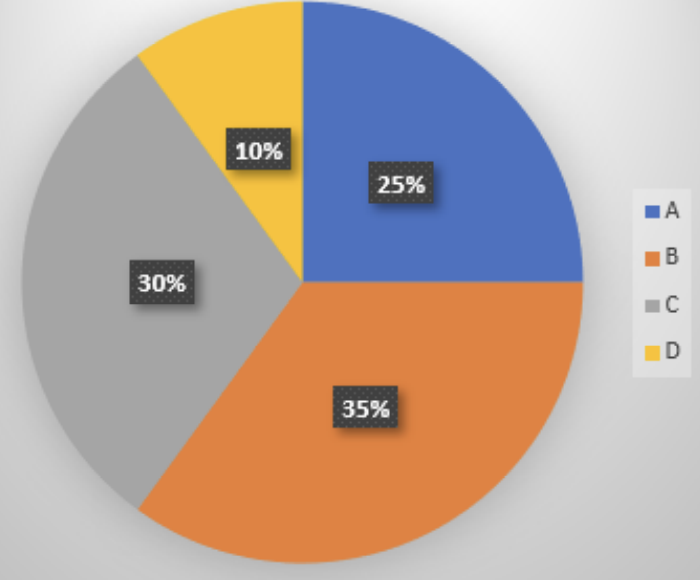
If the difference between the incomes of A and D in 2016 is Rs. 30,000, and the incomes of B and C increased by 40% and 20% respectively in 2017 compared to 2016, find the difference between the incomes of B and C in 2017.