The pie chart represents the income distribution of four earning members of a family as a percentage of the total family income in the year 2016. What...
Question
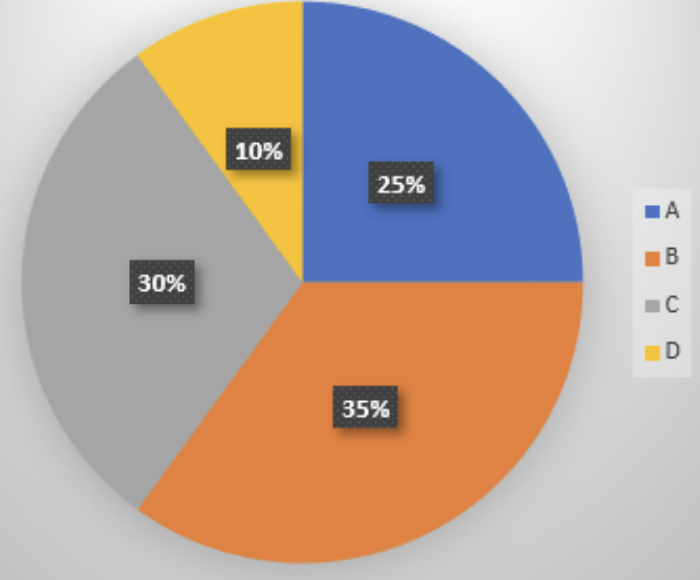
The pie chart represents the income distribution of four earning members of a family as a percentage of the total family income in the year 2016.
What is the central angle corresponding to the combined income of members A and D in the pie chart?