The pie chart below shows the percentage distribution of total pizzas sold by five outlets (P, Q, R, S, and T) of 'Pizza Hut' in 2017: Additio...
Question
The pie chart below shows the percentage distribution of total pizzas sold by five outlets (P, Q, R, S, and T) of 'Pizza Hut' in 2017: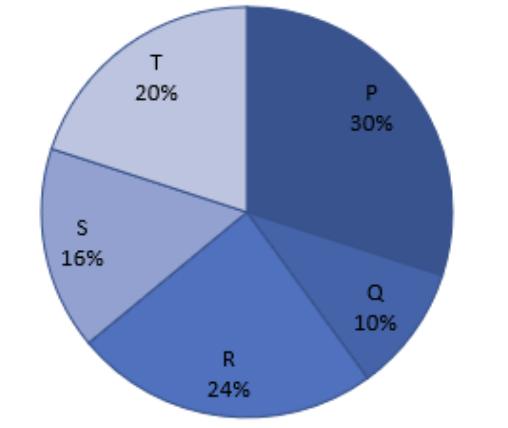
Additional information:
I. The total number of pizzas sold by these five outlets in 2018 is 40% more than the total pizzas sold in 2017.
II. The percentage distribution of pizzas sold by these outlets in 2018 remains the same as in 2017.
If the number of pizzas sold by outlet P in 2018 is 5400 more than the number sold by outlet R in 2017, and the selling price of each pizza at outlet Q in 2018 is Rs. 40, what is the total revenue of outlet Q in 2018?