The pie chart below shows the percentage distribution of total pizzas sold by five outlets (P, Q, R, S, and T) of 'Pizza Hut' in 2017: Additio...
Question
The pie chart below shows the percentage distribution of total pizzas sold by five outlets (P, Q, R, S, and T) of 'Pizza Hut' in 2017: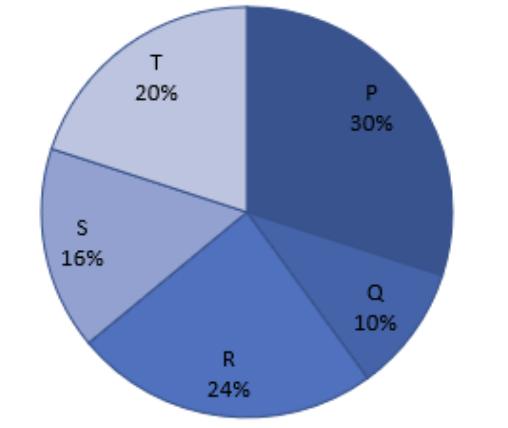
Additional information:
I. The total number of pizzas sold by these five outlets in 2018 is 40% more than the total pizzas sold in 2017.
II. The percentage distribution of pizzas sold by these outlets in 2018 remains the same as in 2017.
Question:
Find the ratio of the average number of pizzas sold by outlets R, S, and T in 2017 to the total number of pizzas sold by outlets P and Q together in 2018.