The bar graph below shows the number of employees working from Office and the percentage of employees working from Home out of the total employees in ...
Question
The bar graph below shows the number of employees working from Office and the percentage of employees working from Home out of the total employees in five different companies. The total number of employees in any company is the sum of employees working from Office and those working from Home.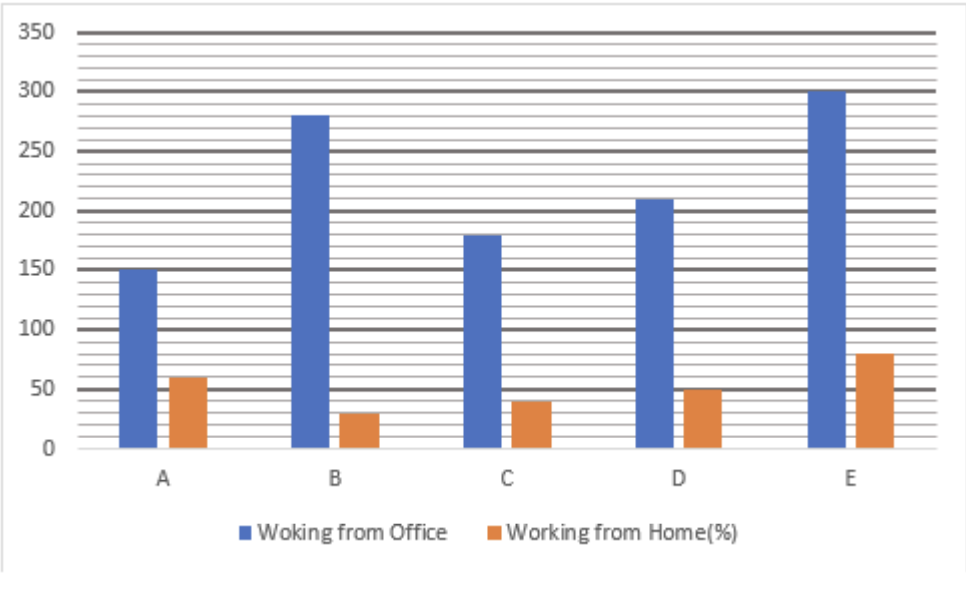
Using the data, find by what percentage the total number of employees working from Home in companies B and D together is more or less than the number of employees working from Office in company C.