The bar graph below shows the number of employees working from the office and the percentage of employees working from home in five different companie...
Question
The bar graph below shows the number of employees working from the office and the percentage of employees working from home in five different companies (A, B, C, D, and E). The total number of employees in each company is the sum of employees working from the office and those working from home.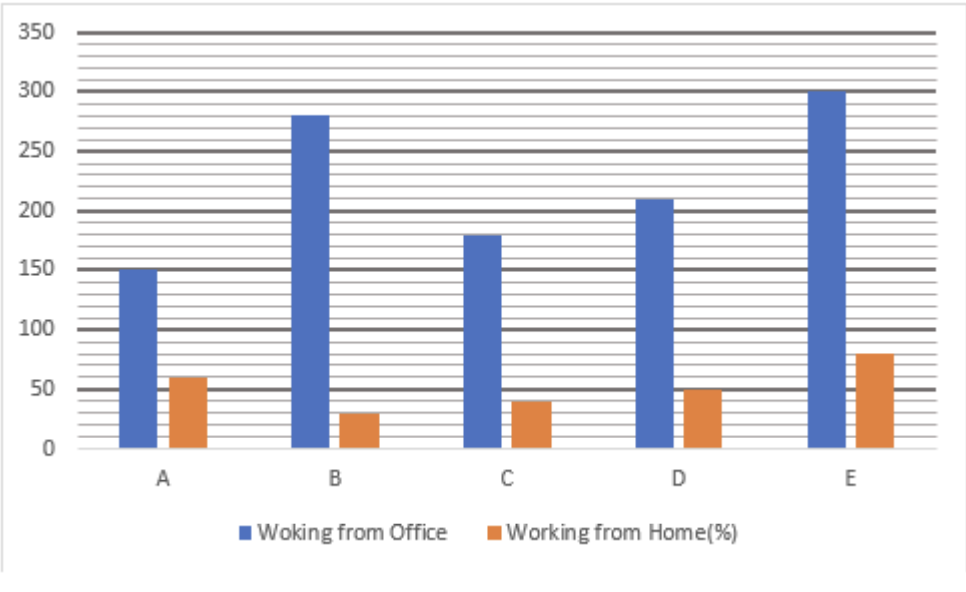
Using the data, find the average number of employees working from home in companies A, C, and D.