The pie chart represents the total number of goods (both sold and unsold) produced by four companies A, B, C, and D, with a total production of 200 un...
Question
The pie chart represents the total number of goods (both sold and unsold) produced by four companies A, B, C, and D, with a total production of 200 units. The distribution is as follows: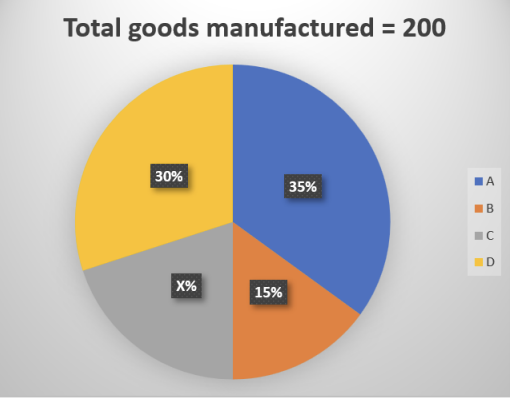
- Company A: 30%
- Company B: 35%
- Company C: 15%
- Company D: Remaining percentage
The table below shows the percentage of goods sold by each company:
| Company | Percentage of Goods Sold |
|---|---|
| A | 90\% |
| B | 80\% |
| C | 75\% |
| D | 4X\% |
If the percentage of goods produced by company D is denoted by , find the ratio of the unsold goods of companies B and C combined to the sold goods of company D.