The bar graph shows the number of employees working from office and the percentage of employees working from home in five companies: A, B, C, D, and E...
Question
The bar graph shows the number of employees working from office and the percentage of employees working from home in five companies: A, B, C, D, and E. The total number of employees in each company is the sum of employees working from office and those working from home.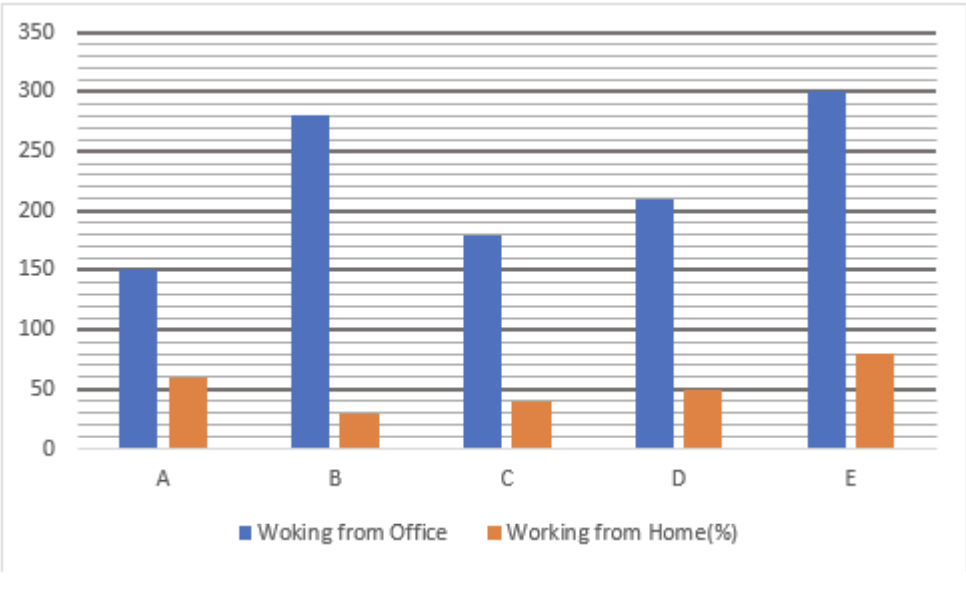
If the number of employees working from office in company C is 200 and the percentage of employees working from home in company C is 20%, and in company E the number of employees working from office is 90 with 80% employees working from home, find the ratio of employees working from home in company E to those in company C.