Bar graph (i) shows the number of total balls of three different colors (Red + Blue + Green) in four different (A, B, C & D) bags and bar graph (i...
Question
Bar graph (i) shows the number of total balls of three different colors (Red + Blue + Green) in four different (A, B, C & D) bags and bar graph (ii) shows the probability of picking a red ball from each of bag’s A and C and probability of picking a green ball from each of bag’s B and D. Read the data and answer the following questions.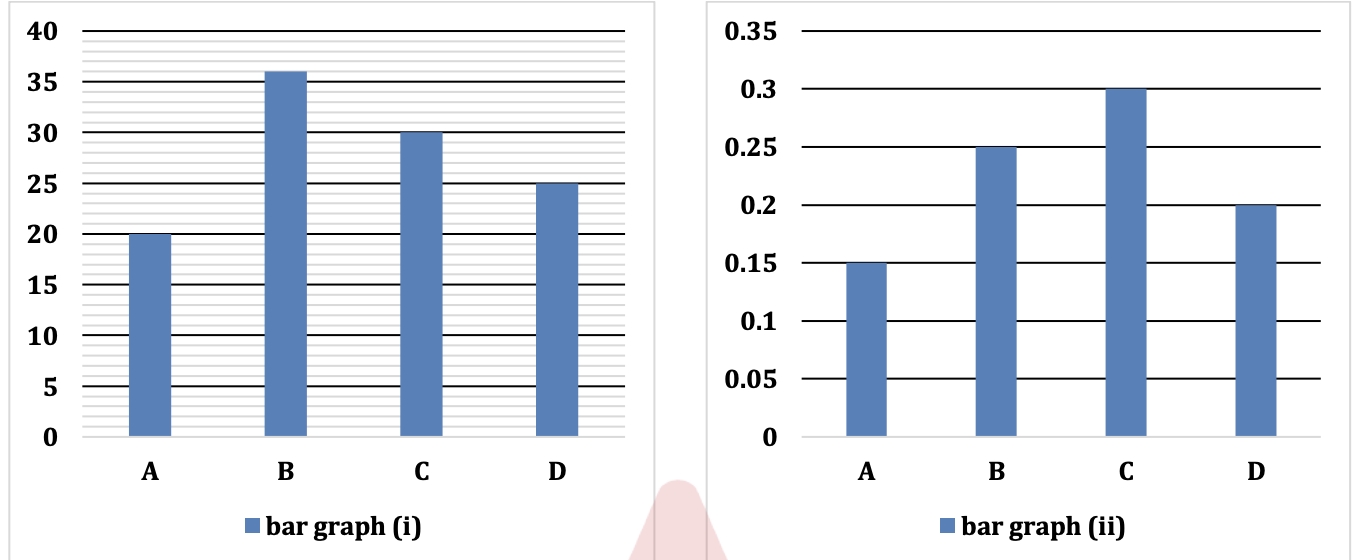
Given:
- Blue balls in bag C are 20% more than green balls in bag D.
Find the sum of the probability of picking one green ball from bag C and one green ball from bag B.