Bar graph (i) shows the number of total balls of three different colors (Red + Blue + Green) in four different (A, B, C & D) bags and bar graph (i...
Question
Bar graph (i) shows the number of total balls of three different colors (Red + Blue + Green) in four different (A, B, C & D) bags and bar graph (ii) shows the probability of picking a red ball from each of bag’s A and C and probability of picking a green ball from each of bag’s B and D. Read the data and answer the following questions.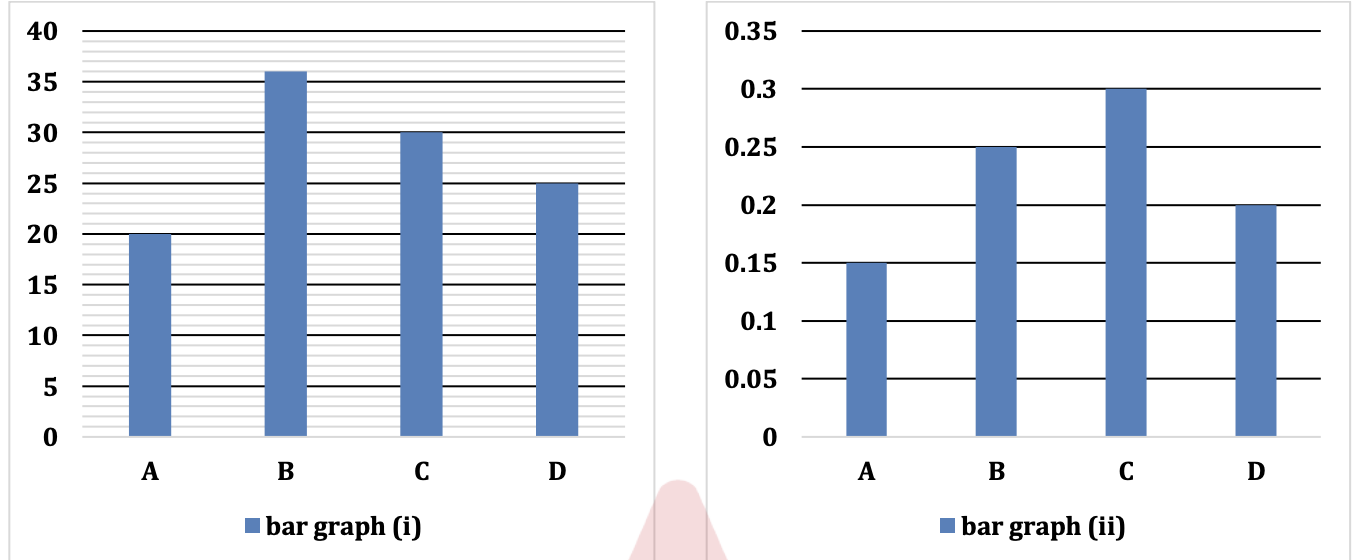
In bag X, the count of red balls is the smallest prime number, and the count of green balls is the largest one-digit number. If the probability of drawing a blue ball from bag X is three times the probability of drawing a red ball from bag A, determine the number of blue balls in bag X. (Assume only three colors of balls in bag X.)