Bar graph (i) shows the number of total balls of three different colors (Red + Blue + Green) in four different (A, B, C & D) bags and bar graph (i...
Question
Bar graph (i) shows the number of total balls of three different colors (Red + Blue + Green) in four different (A, B, C & D) bags and bar graph (ii) shows the probability of picking a red ball from each of bag’s A and C and probability of picking a green ball from each of bag’s B and D. Read the data and answer the following questions.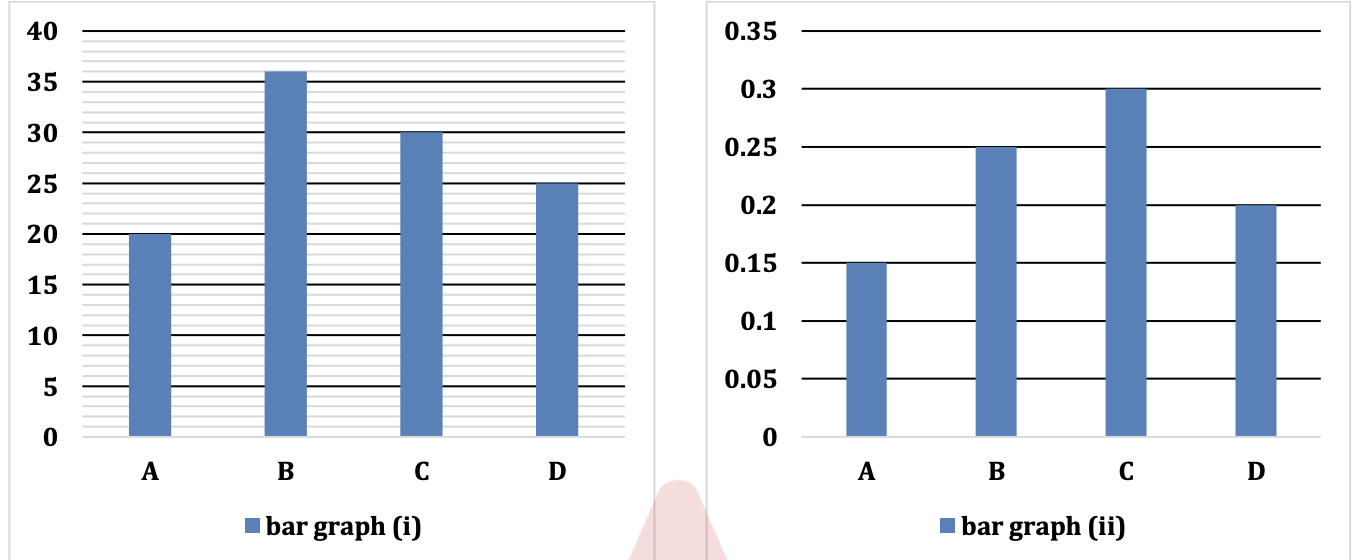
If the number of blue balls in bag A is a perfect cube and the number of green balls in bag A is a perfect square, and also the number of blue balls is less than the number of green balls, what is the possible number of green balls in bag A?