Bar graph (i) shows the total number of balls of three different colors (Red + Blue + Green) in four bags labeled A, B, C, and D. Bar graph (ii) shows...
Question
Bar graph (i) shows the total number of balls of three different colors (Red + Blue + Green) in four bags labeled A, B, C, and D. Bar graph (ii) shows the probability of picking a red ball from bags A and C, and the probability of picking a green ball from bags B and D.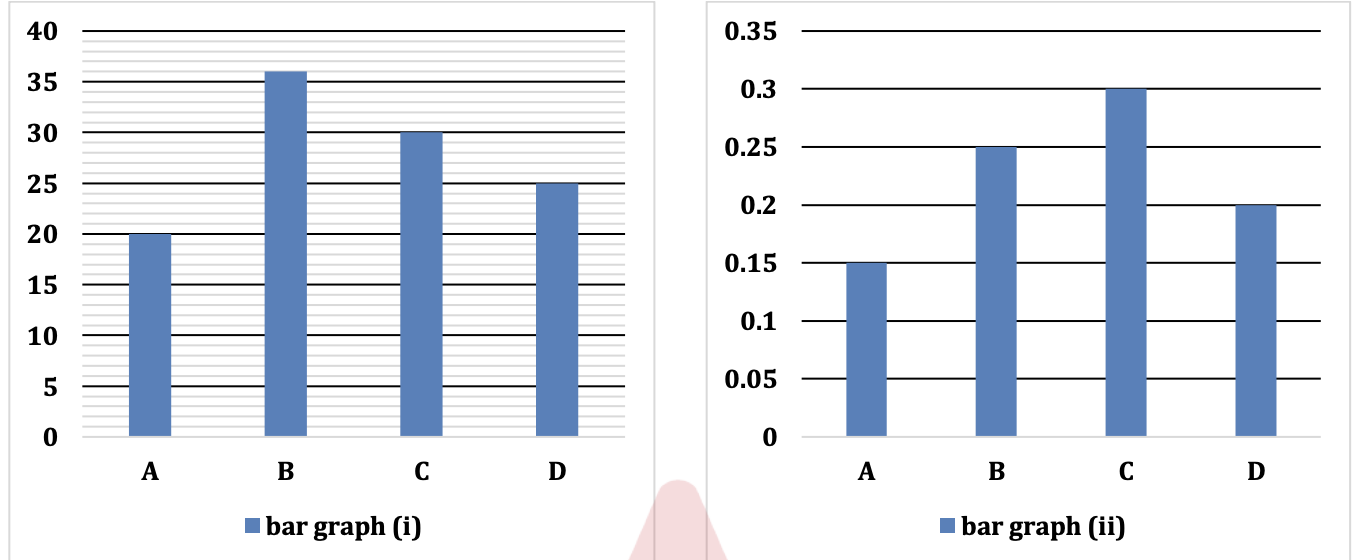
Given:
- The sum of green balls in all four bags is 30.
- The number of green balls in bag C is 4 more than the number of green balls in bag A.
Using this information, find the difference between the total number of blue balls in bags A and C.