The scatter chart below shows the number of boys (Y-axis) and number of girls (X-axis) in three different classes: P, Q, and R.
Note: If there were 10 more girls in class R, then the probability of selecting a girl from class R would be 40%.
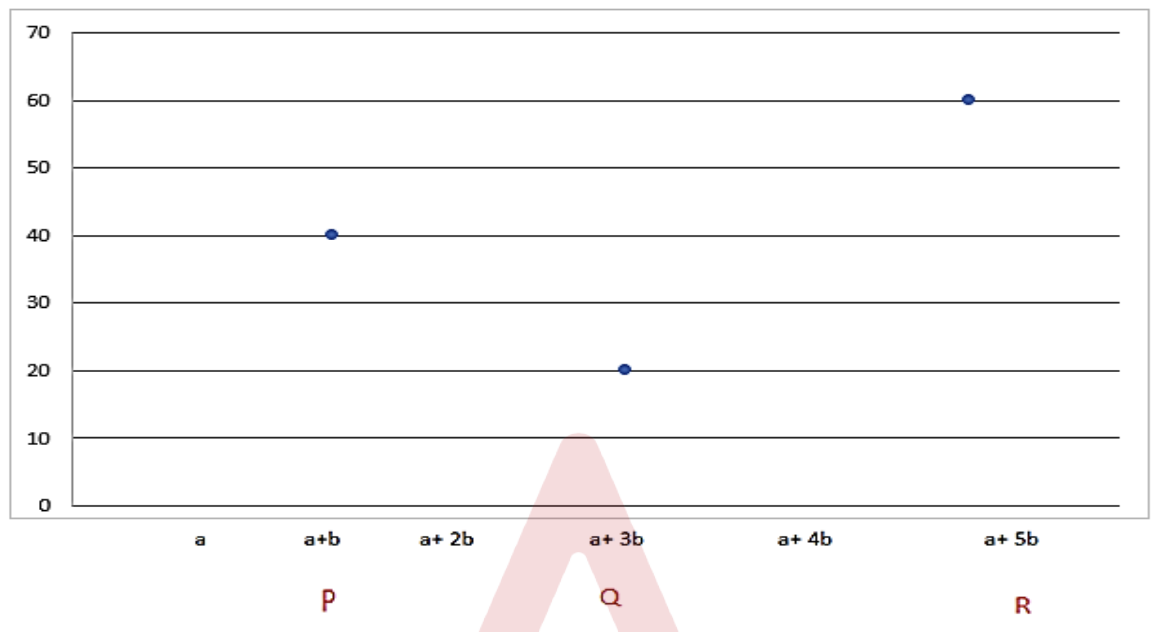
The number of girls in class Q is <spanclass="katex"><spanclass="katex−mathml"><mathxmlns="http://www.w3.org/1998/Math/MathML"><semantics><mrow><mfrac><mn>200</mn><mn>3</mn></mfrac></mrow><annotationencoding="application/x−tex">3200</annotation></semantics></math></span><spanclass="katex−html"aria−hidden="true"><spanclass="base"><spanclass="strut"style="height:1.1901em;vertical−align:−0.345em;"></span><spanclass="mord"><spanclass="mopennulldelimiter"></span><spanclass="mfrac"><spanclass="vlist−tvlist−t2"><spanclass="vlist−r"><spanclass="vlist"style="height:0.8451em;"><spanstyle="top:−2.655em;"><spanclass="pstrut"style="height:3em;"></span><spanclass="sizingreset−size6size3mtight"><spanclass="mordmtight"><spanclass="mordmtight">3</span></span></span></span><spanstyle="top:−3.23em;"><spanclass="pstrut"style="height:3em;"></span><spanclass="frac−line"style="border−bottom−width:0.04em;"></span></span><spanstyle="top:−3.394em;"><spanclass="pstrut"style="height:3em;"></span><spanclass="sizingreset−size6size3mtight"><spanclass="mordmtight"><spanclass="mordmtight">200</span></span></span></span></span><spanclass="vlist−s"></span></span><spanclass="vlist−r"><spanclass="vlist"style="height:0.345em;"><span></span></span></span></span></span><spanclass="mclosenulldelimiter"></span></span></span></span></span>% of the number of girls in class R. If the number of boys in class S is 20% more than the boys in class Q and the number of girls in class S is the same as that of class Q, then find the probability of selecting two girls from class S.