The scatter chart below shows the number of boys (Y-axis) and number of girls (X-axis) in three different classes: P, Q, and R. Note: If there were 10...
Question
The scatter chart below shows the number of boys (Y-axis) and number of girls (X-axis) in three different classes: P, Q, and R.
Note: If there were 10 more girls in class R, then the probability of selecting a girl from class R would be 40%.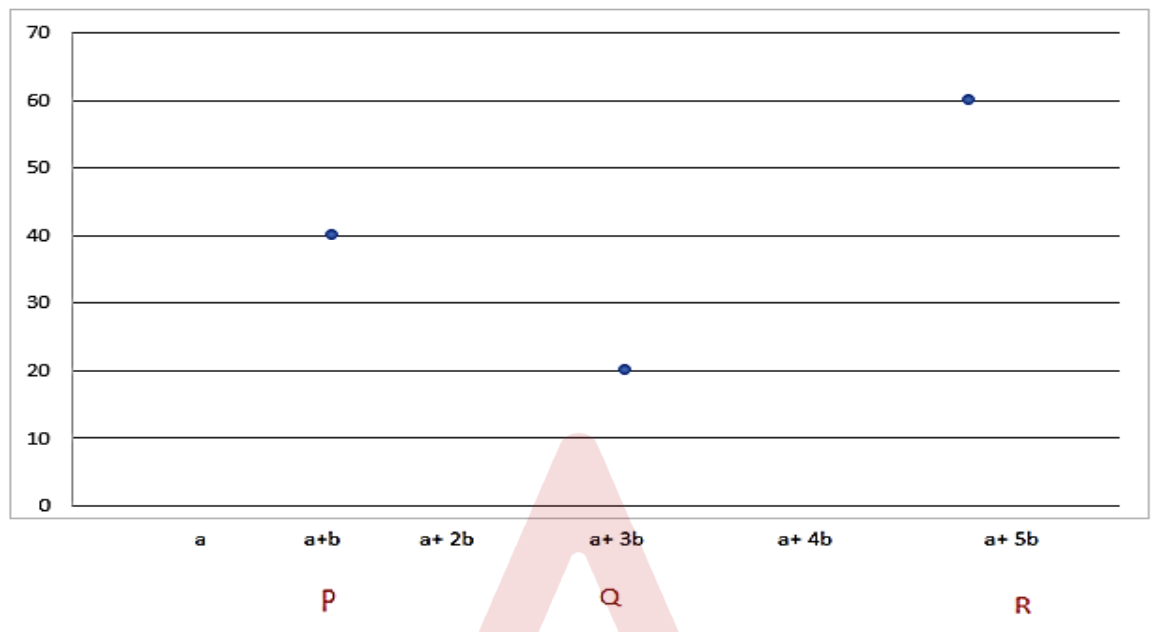
If the number of girls in class P is 25% of the number of boys in class P, find the difference between the total number of students in class P and class Q.