The scatter chart given below shows the number of boys on (Y – axis) and number of girls (X – axis) in three different class of P, Q and R. NOTE: If t...
Question
The scatter chart given below shows the number of boys on (Y – axis) and number of girls (X – axis) in three different class of P, Q and R. NOTE: If there were 10 more girls in class R then the probability of selecting a girl from R would be 40%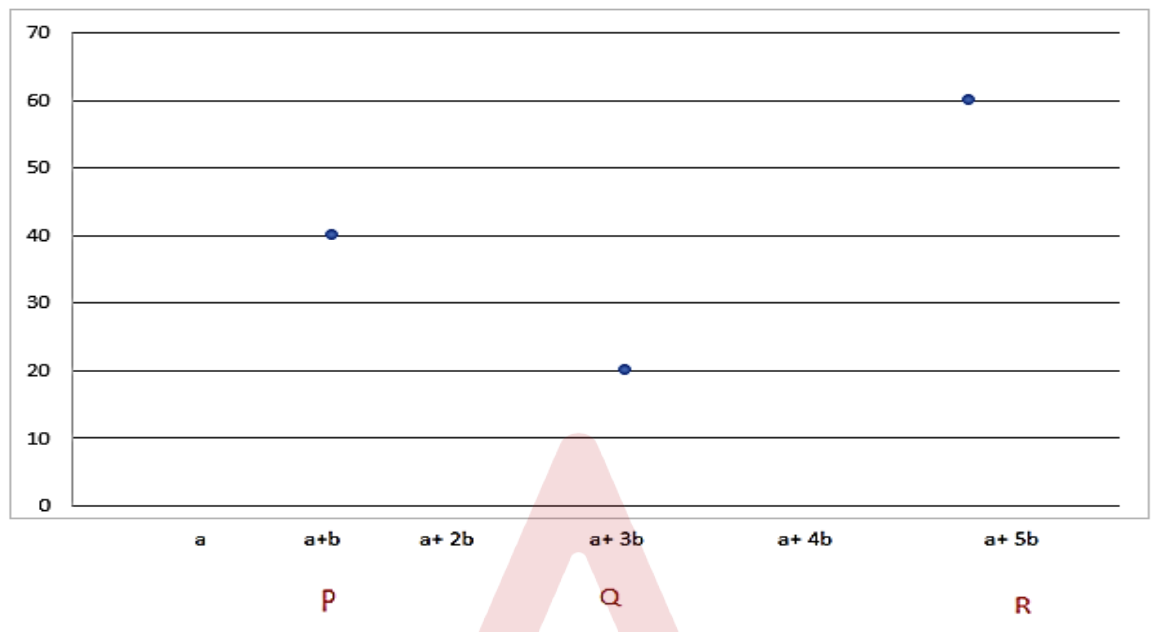
Find the difference between the number of ways to form group A and group B.