The bar graph shows the percentage distribution of stocks sold by Ram to six different people: P, Q, R, S, T, and U. The total value of Ram's stoc...
Question
The bar graph shows the percentage distribution of stocks sold by Ram to six different people: P, Q, R, S, T, and U. The total value of Ram's stocks is Rs. 3,60,000. The table below provides the percentage increment in the price of stocks over two years and the overall percentage increment.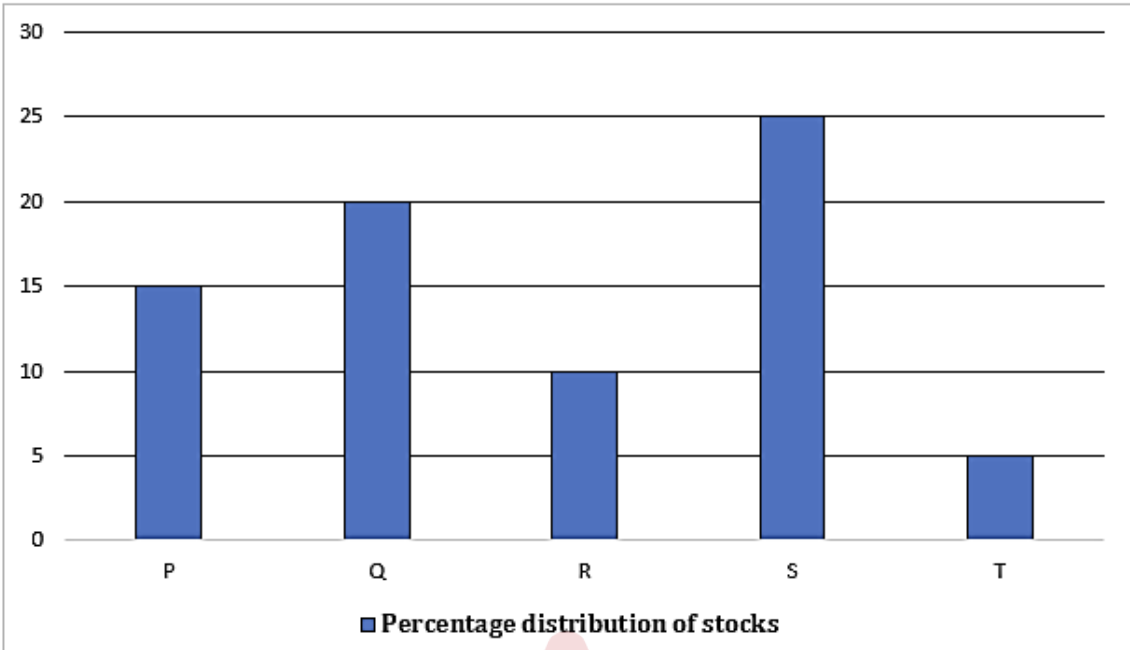
| Person | % Increment in 1st Year | % Increment in 2nd Year | Overall % Increment |
|---|---|---|---|
| P | - | - | 21 |
| Q | - | - | 69 |
| R | - | - | 56.25 |
| S | 20 | - | 44 |
| T | - | - | 82.25 |
| U | - | - | 32.25 |
If the percentage increments for both years are equal for persons T and S, find the combined return from T and S when calculated after 1 year.