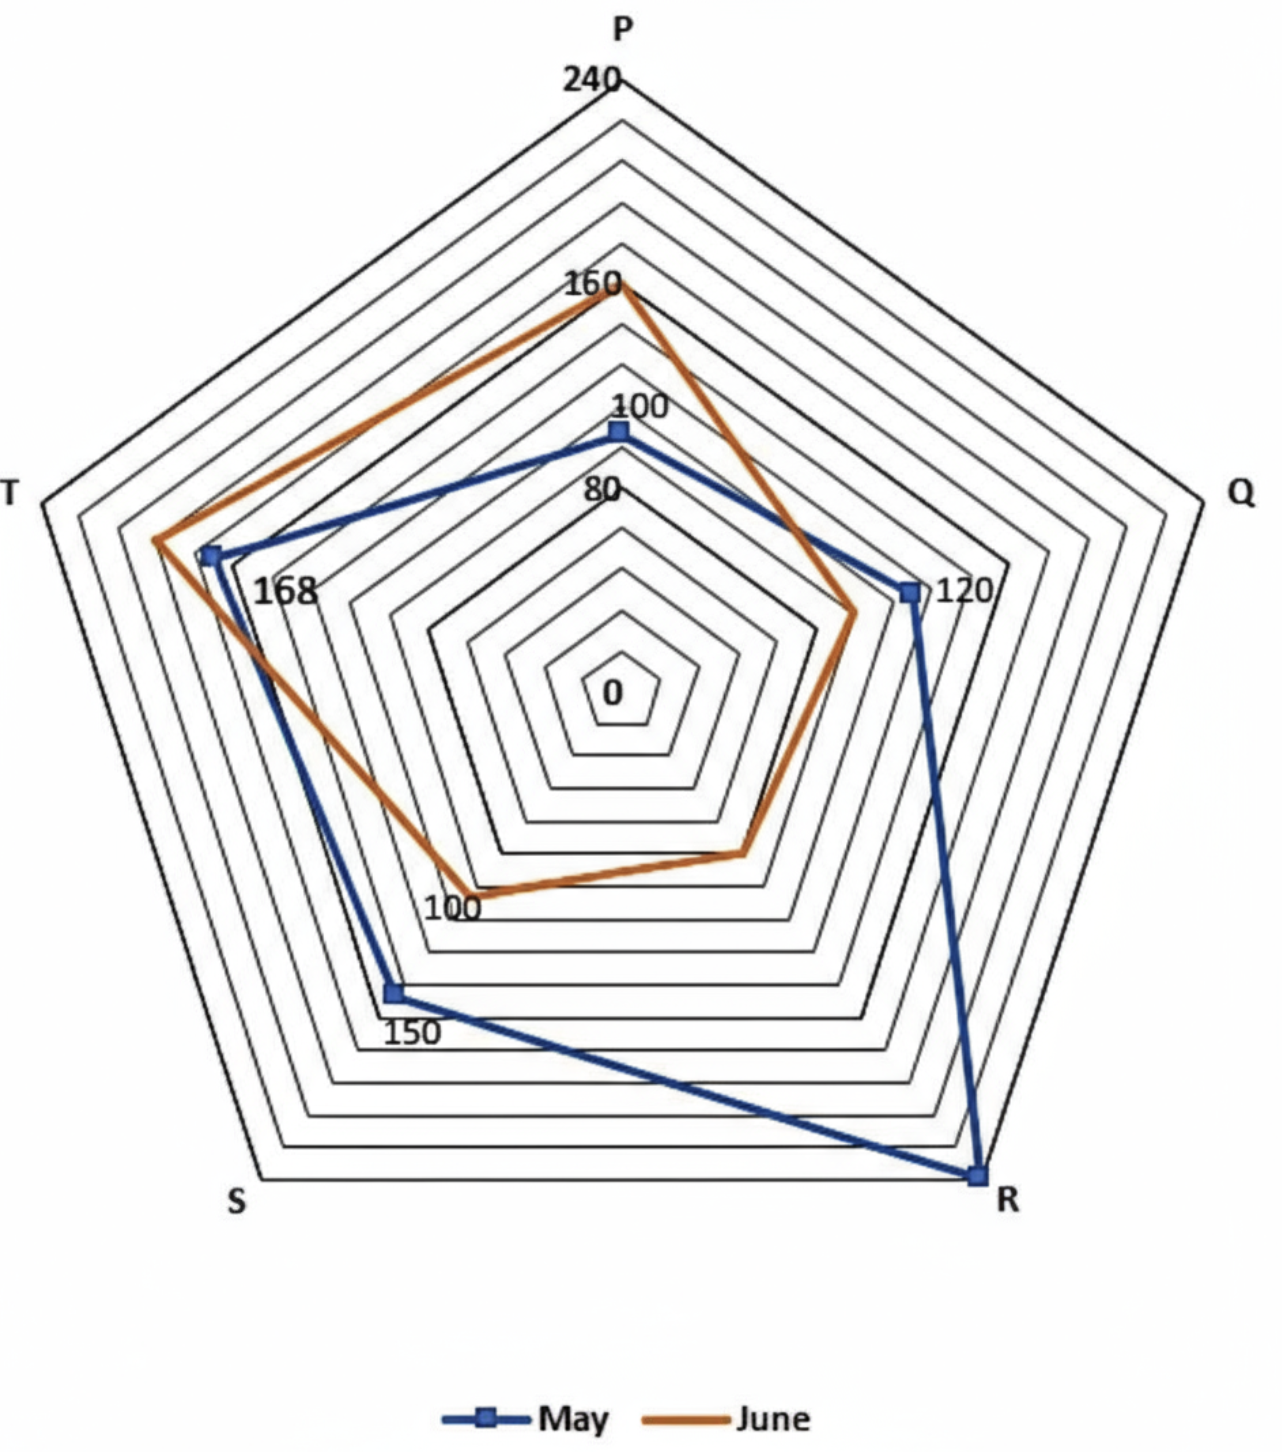
The radar graph below displays the total number of buckets (plastic + wooden) sold by five shops (P, Q, R, S, and T) in the months of May and June. In...
Question
The radar graph below displays the total number of buckets (plastic + wooden) sold by five shops (P, Q, R, S, and T) in the months of May and June. In May, the total wooden buckets sold by shop R were 200% more than those sold by shop S. Also, the number of plastic buckets sold by R in May is greater than the number of plastic buckets sold by S in May. Based on this information, which of the following cannot be the number of plastic buckets sold by R in May?