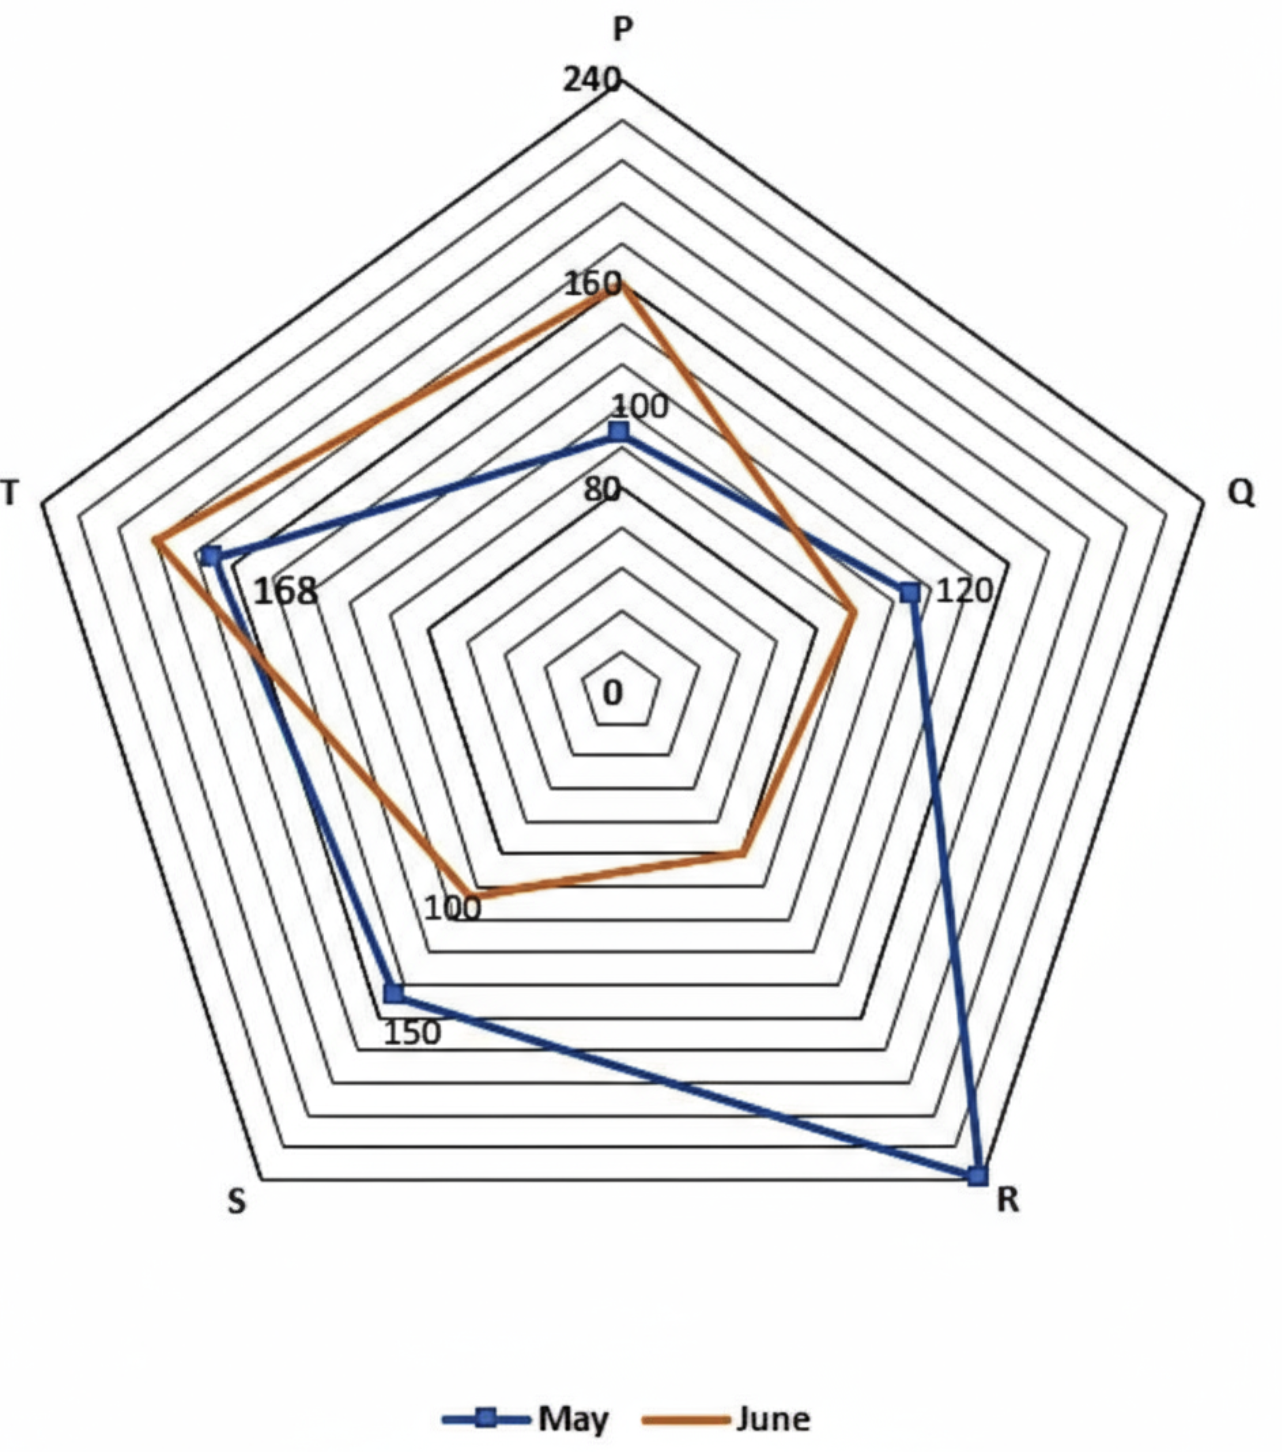
The radar graph shows the total number of buckets (plastic + wooden) sold by five shops (P, Q, R, S, and T) in May and June. For shop P in June, 40% of the buckets sold are plastic, and <spanclass="katex"><spanclass="katex−mathml"><mathxmlns="http://www.w3.org/1998/Math/MathML"><semantics><mrow><mfrac><mn>1</mn><mn>8</mn></mfrac></mrow><annotationencoding="application/x−tex">81</annotation></semantics></math></span><spanclass="katex−html"aria−hidden="true"><spanclass="base"><spanclass="strut"style="height:1.1901em;vertical−align:−0.345em;"></span><spanclass="mord"><spanclass="mopennulldelimiter"></span><spanclass="mfrac"><spanclass="vlist−tvlist−t2"><spanclass="vlist−r"><spanclass="vlist"style="height:0.8451em;"><spanstyle="top:−2.655em;"><spanclass="pstrut"style="height:3em;"></span><spanclass="sizingreset−size6size3mtight"><spanclass="mordmtight"><spanclass="mordmtight">8</span></span></span></span><spanstyle="top:−3.23em;"><spanclass="pstrut"style="height:3em;"></span><spanclass="frac−line"style="border−bottom−width:0.04em;"></span></span><spanstyle="top:−3.394em;"><spanclass="pstrut"style="height:3em;"></span><spanclass="sizingreset−size6size3mtight"><spanclass="mordmtight"><spanclass="mordmtight">1</span></span></span></span></span><spanclass="vlist−s"></span></span><spanclass="vlist−r"><spanclass="vlist"style="height:0.345em;"><span></span></span></span></span></span><spanclass="mclosenulldelimiter"></span></span></span></span></span> of these plastic buckets are defective. Additionally, 25% of the wooden buckets sold by P in June are defective. The total wooden buckets sold by Q in June are 50% more than the difference between the non-defective plastic and wooden buckets sold by P in June. If shop Q sold 168 buckets in May, what percentage of the total buckets sold by Q in May are plastic buckets sold by Q in June?