The radar graph shows the number of buckets (plastic + wooden) sold by five shops (P, Q, R, S, and T) in May and June. In May, the total number of pla...
Question
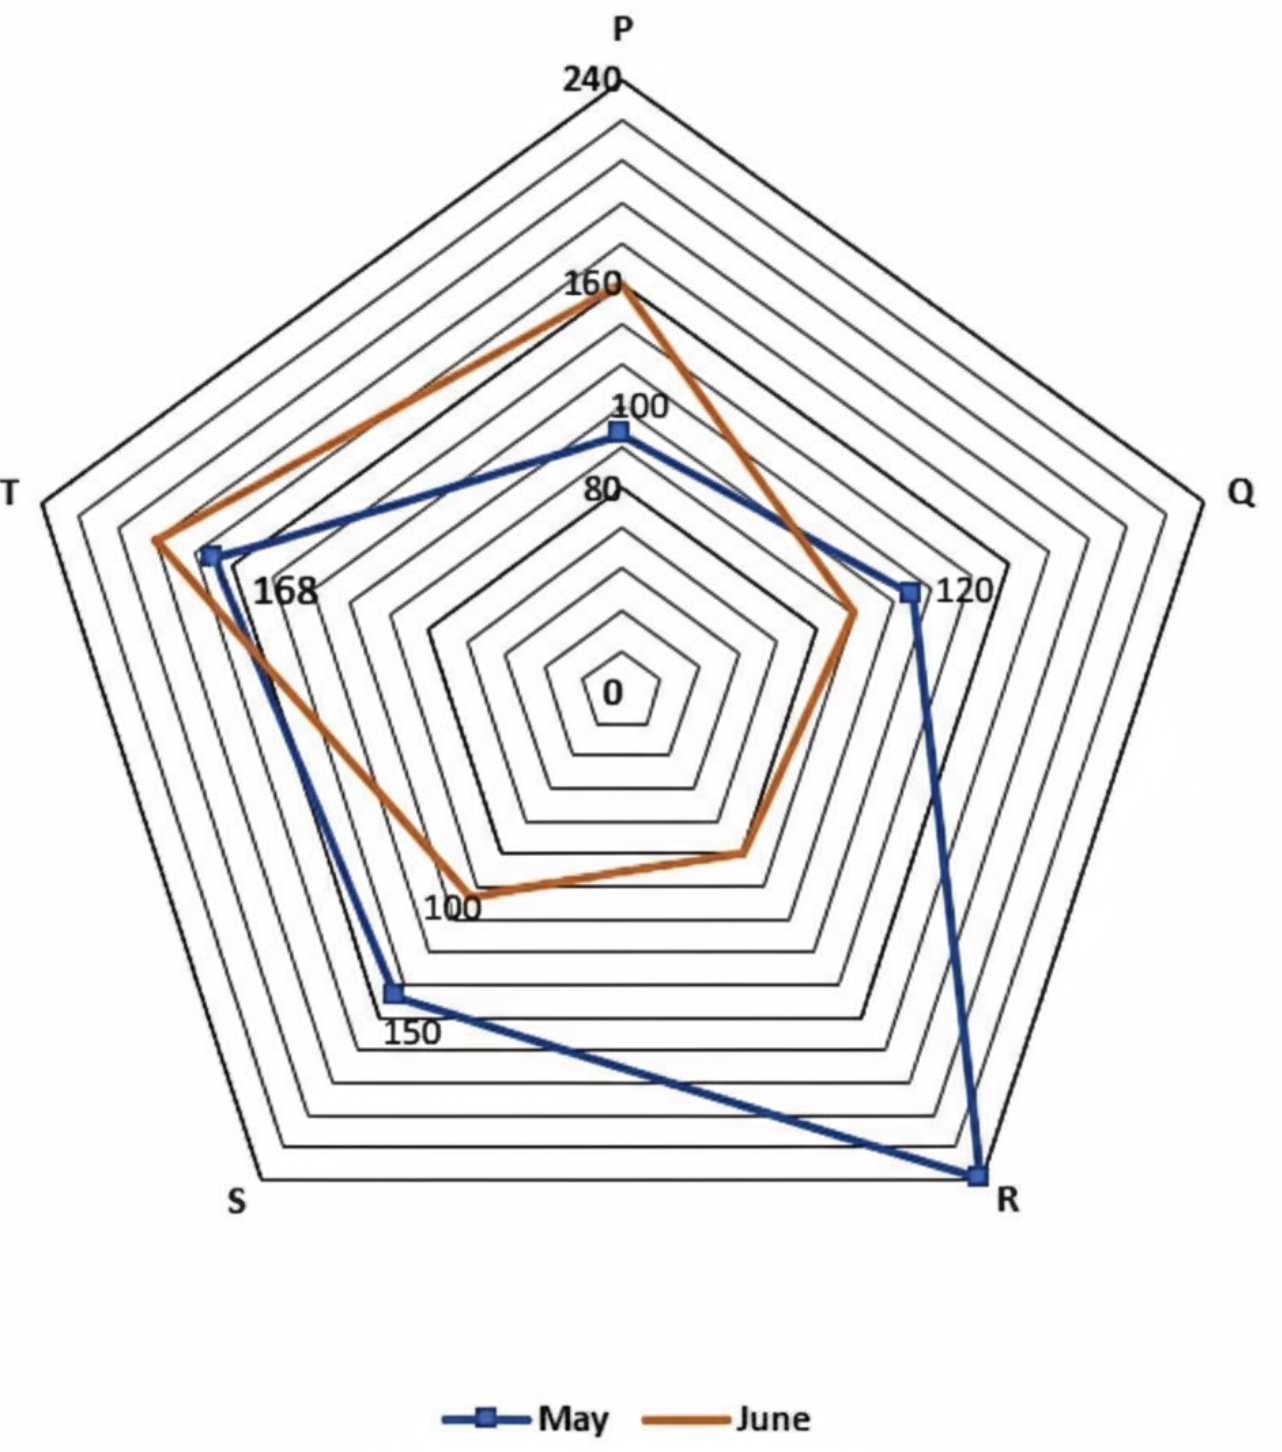
The radar graph shows the number of buckets (plastic + wooden) sold by five shops (P, Q, R, S, and T) in May and June.
In May, the total number of plastic buckets sold by shop T is four times the difference between the total number of buckets sold by shop Q in May and June combined. Given that the number of wooden buckets sold by T in June is greater than that in May and is a perfect square of an even number, find the minimum possible average of the total wooden buckets sold by T in May and the total plastic buckets sold by T in June.