The bar graph represents the total number of students in four schools A, B, C, and D, along with the difference between the number of boys and girls i...
Question
The bar graph represents the total number of students in four schools A, B, C, and D, along with the difference between the number of boys and girls in each school.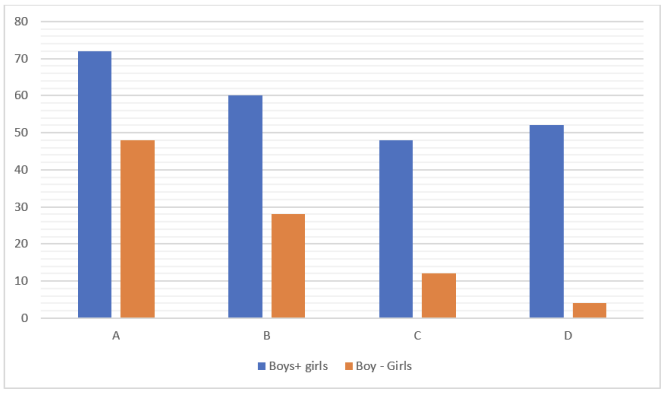
Using the data, find the average number of girls in schools A, C, and D.