The bar graph shows the total number of students in four schools (A, B, C, and D) along with the difference between the number of boys and girls in ea...
Question
The bar graph shows the total number of students in four schools (A, B, C, and D) along with the difference between the number of boys and girls in each school.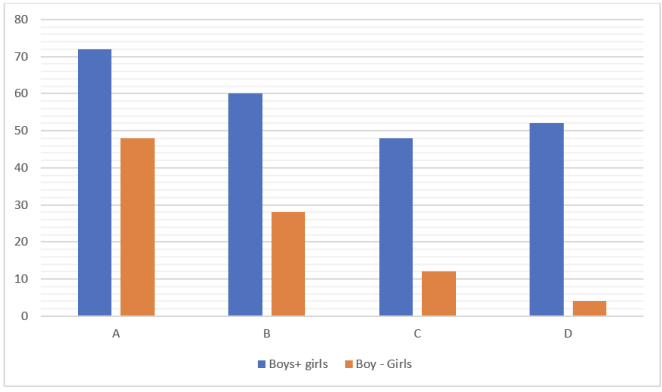
Total girls in A and B together is what percentage
of more than that of girls in C.