The bar graph shows the total number of students (boys + girls) and the difference between the number of boys and girls (boys - girls) in four schools...
Question
The bar graph shows the total number of students (boys + girls) and the difference between the number of boys and girls (boys - girls) in four schools A, B, C, and D.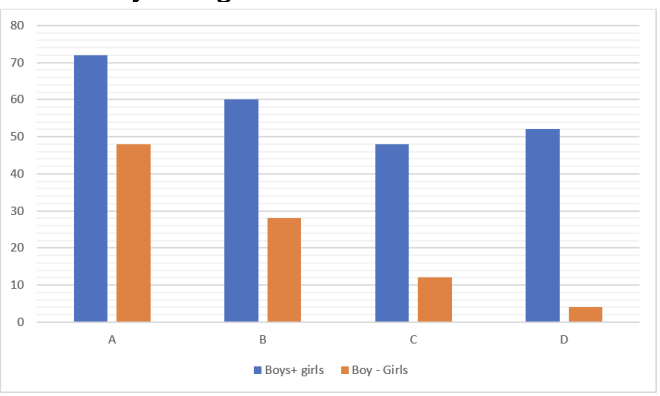
If the number of boys in school D increases by 25% and the number of girls decreases by 50%, what will be the new total number of students in school D?