The bar graph below shows the total number of students (boys + girls) and the difference between the number of boys and girls in four schools A, B, C,...
Question
The bar graph below shows the total number of students (boys + girls) and the difference between the number of boys and girls in four schools A, B, C, and D.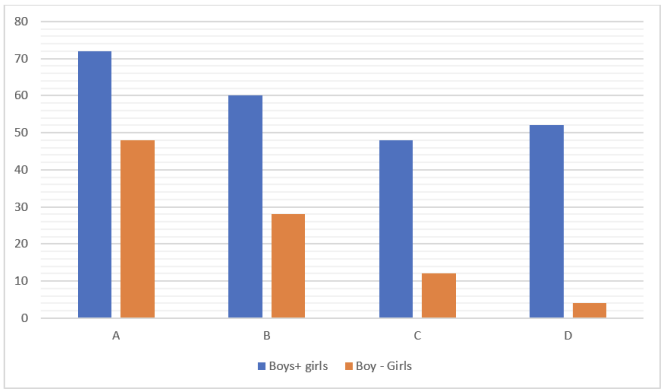
Using the data, find the ratio of 50% of the total students in schools B and C to the total number of boys in schools A and D.