The bar graph represents the total number of students in four schools: A, B, C, and D, along with the difference between the number of boys and girls ...
Question
The bar graph represents the total number of students in four schools: A, B, C, and D, along with the difference between the number of boys and girls in each school.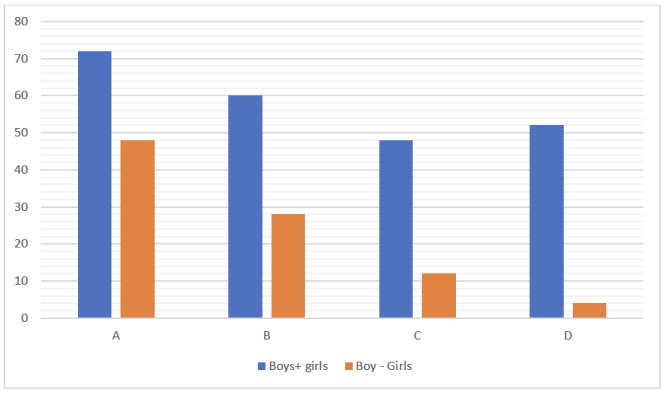
In school E, the ratio of boys to girls is . The number of boys in school E is 50% more than the total number of girls in schools A and B combined.
Find the number of girls in school E.