The bar chart shows the total number of students in four schools (A, B, C, D) along with the difference between the number of boys and girls in each s...
Question
The bar chart shows the total number of students in four schools (A, B, C, D) along with the difference between the number of boys and girls in each school.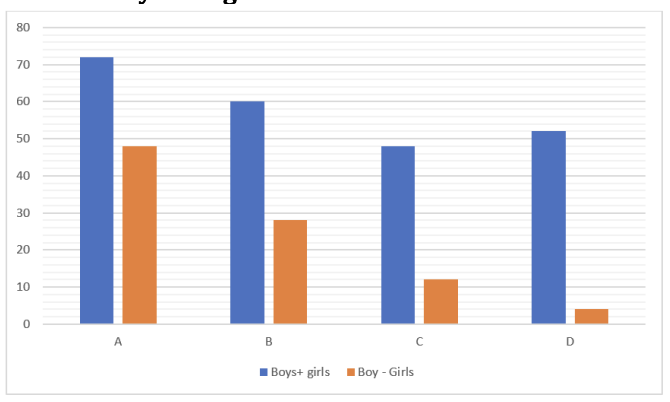
25% of the total students in C are absent and out
of that 10 girls are absent. Find the absent boys in C is
how many more/less than total girls in D.