The bar graph shows the total number of complaints filed and total unaddressed complaints in five different cities. Note that total complaints = addre...
Question
The bar graph shows the total number of complaints filed and total unaddressed complaints in five different cities.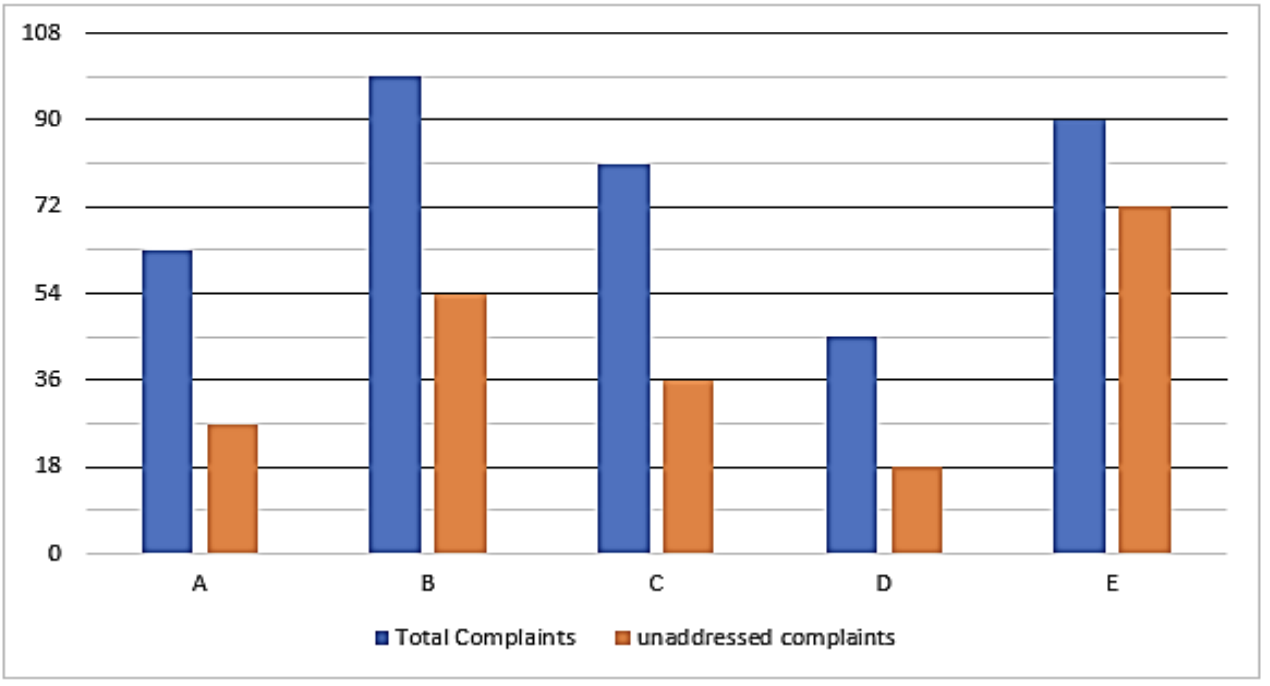
Note that total complaints = addressed complaints + unaddressed complaints.
Find the ratio of unaddressed complaints in cities C and D combined to the addressed complaints in cities A and E combined.