The bar graph shows the total number of complaints filed and the total unaddressed complaints in five different cities A, B, C, D, and E. Note that to...
Question
The bar graph shows the total number of complaints filed and the total unaddressed complaints in five different cities A, B, C, D, and E. 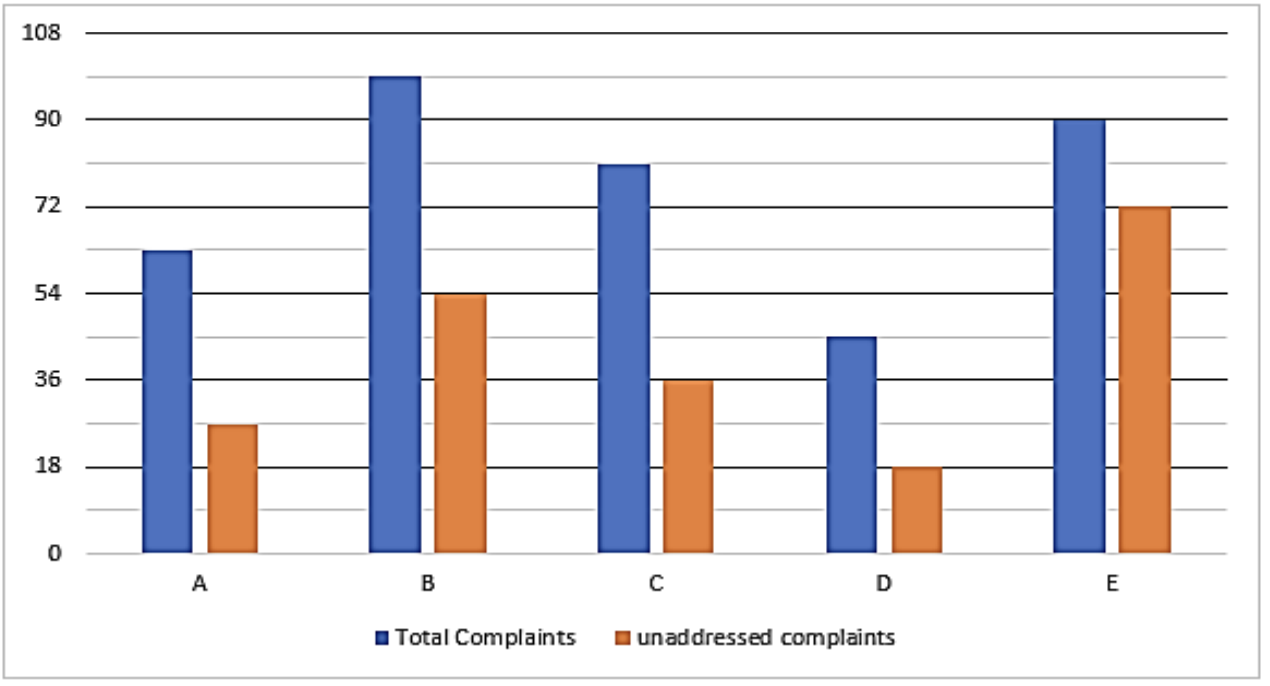
Note that total complaints = addressed complaints + unaddressed complaints.
In city F, the total complaints filed are equal to the average of the total complaints filed in cities A and D. The ratio of unaddressed complaints in city F to addressed complaints in city C is 4:5. Find the number of addressed complaints in city F.