The pie chart represents the percentage distribution of profit earned by a company on Monday from selling five different items. The profit percentages...
Question
The pie chart represents the percentage distribution of profit earned by a company on Monday from selling five different items. The profit percentages are as follows:
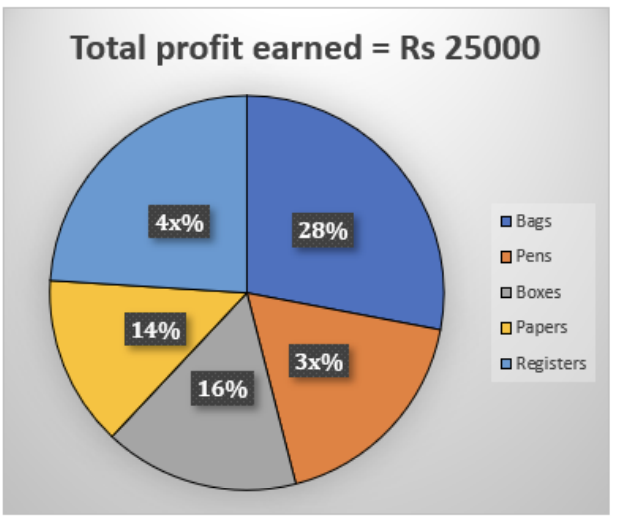
What is the central angle (in degrees) corresponding to the profit earned from selling pens on Monday?