The bar graph below shows the total number of employees (males and females) working in five different companies: A, B, C, D, and E. The table provides...
Question
The bar graph below shows the total number of employees (males and females) working in five different companies: A, B, C, D, and E. The table provides the percentage of females in each company.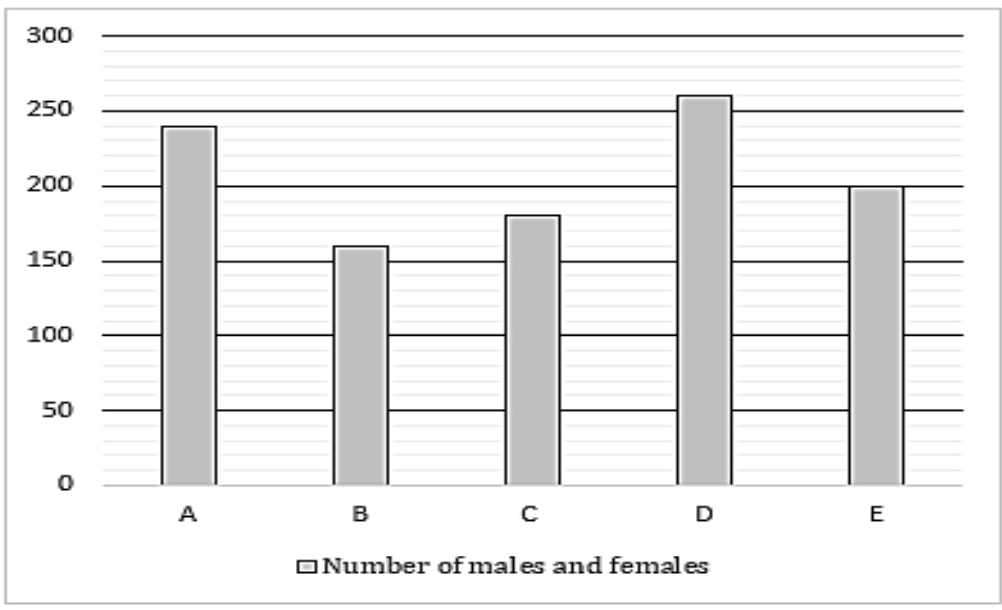
| Company | Total Employees | Percentage of Females |
|---|---|---|
| A | 250 | 40\% |
| B | 150 | 60\% |
| C | 180 | 20\% |
| D | 230 | 50\% |
| E | 200 | 80\% |
What is the percentage difference between the average number of females in companies B and C together and the total number of males in company E?
Calculate how much more or less the average number of females in B and C is compared to the total males in E, expressed as a percentage.