Read the following Bar graph and table carefully and answer the questions given below. The Bar graph shows the total number of employees (males and fe...
Question
Read the following Bar graph and table carefully and answer the questions
given below. The Bar graph shows the total number of employees (males and females) working
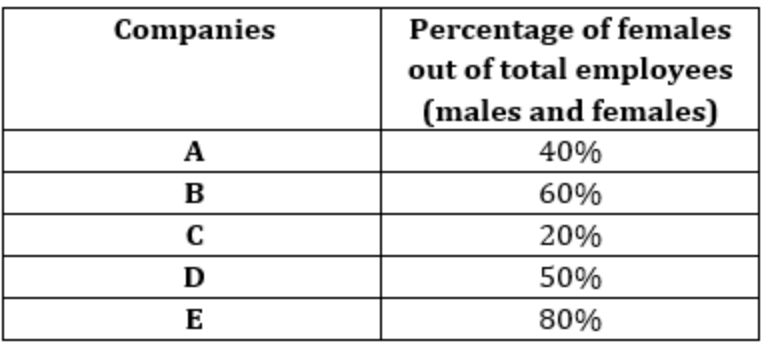
in five different companies. The table shows the percentage of females out of total employees in
these companies.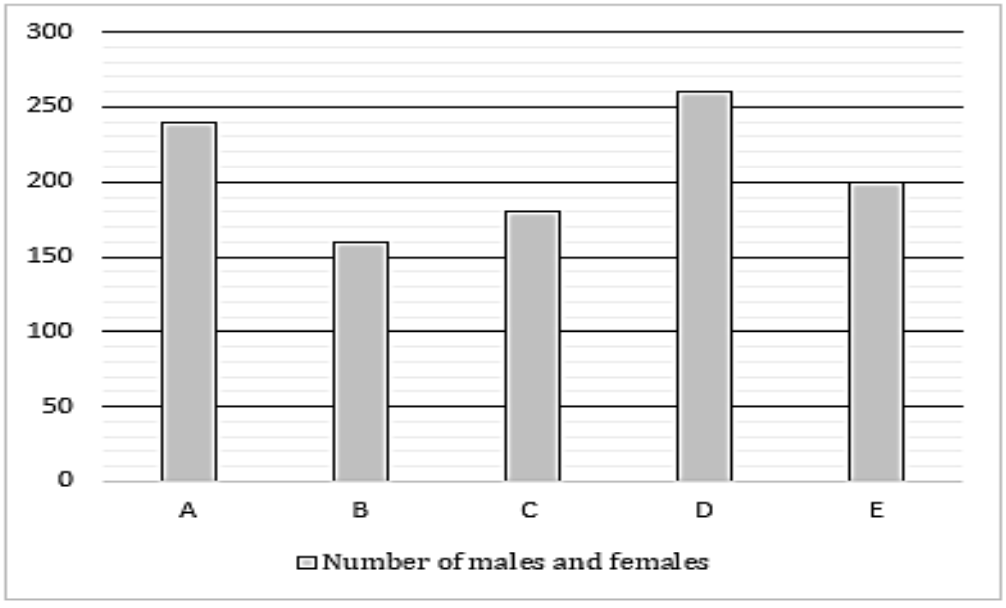
The total number of males in company X is 5 more than the average number of females in companies E and D. If the total number of employees in company X is 25% more than that in company A, find the total number of females in company X.
Given data:
- Total employees in A = 250
- Females in D = 130
- Females in E = 160
Use the above information to calculate the females in X.