The bar graph shows the total number of employees (males and females) working in five different companies. The table provides the percentage of female...
Question
The bar graph shows the total number of employees (males and females) working in five different companies. The table provides the percentage of females among the total employees in these companies.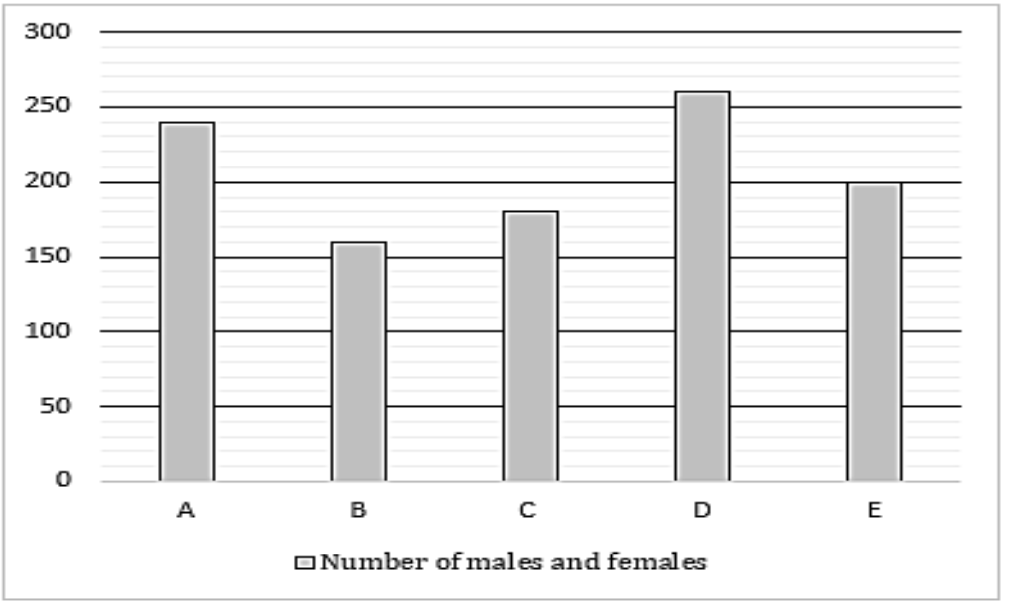
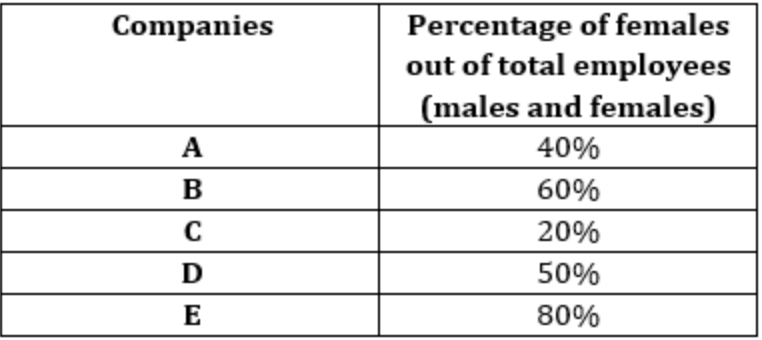
If each male employee works 8 hours per day and each female employee works 6 hours per day in company C, what is the difference between the total number of hours worked by all males and all females in a week in company C?