The bar graph shows the total number of employees (males and females) working in five different companies. The table shows the percentage of females o...
Question
The bar graph shows the total number of employees (males and females) working in five different companies. The table shows the percentage of females out of the total employees in these companies.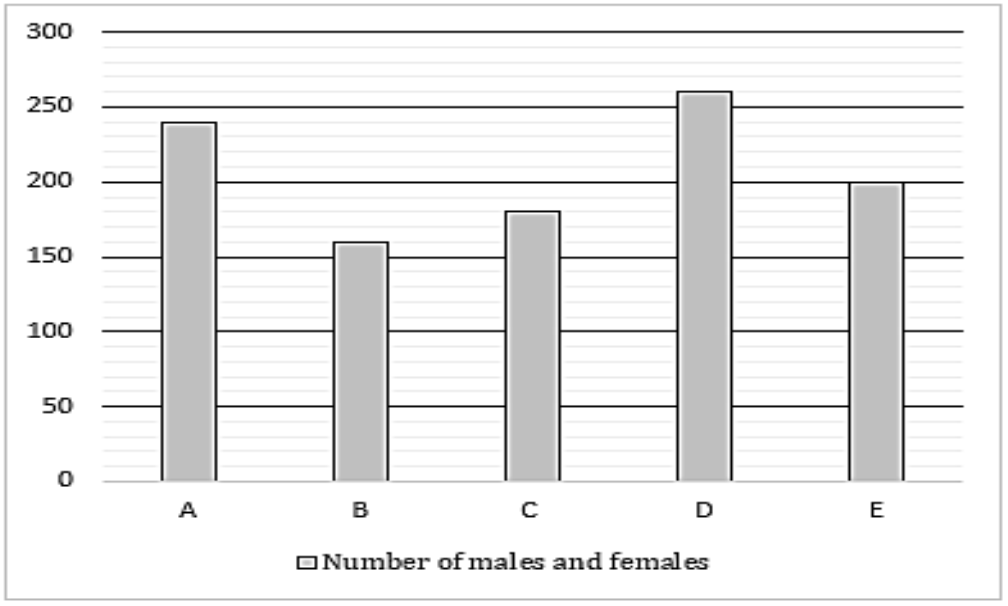
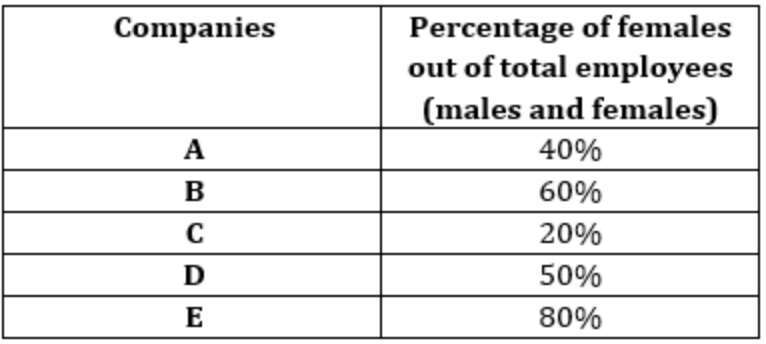
In company A, one-fourth of the total males and of the total females work in the sales department. The rest work in the HR department. Find the average number of males and females who work in the HR department in company A.