The bar graph displays the total number of employees (males and females combined) working in five companies: A, B, C, D, and E. The accompanying table...
Question
The bar graph displays the total number of employees (males and females combined) working in five companies: A, B, C, D, and E. The accompanying table provides the percentage of female employees in each company.
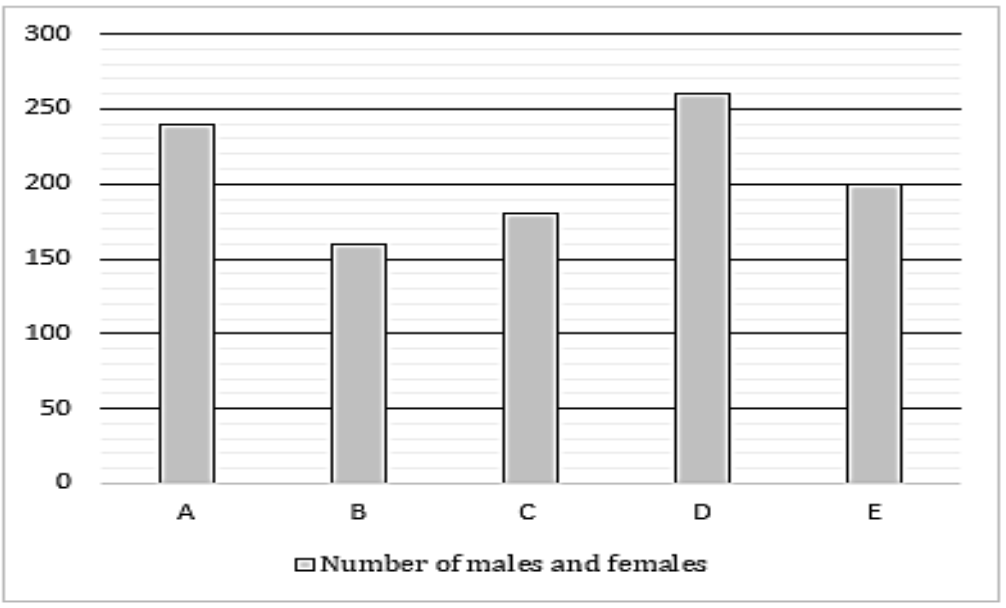
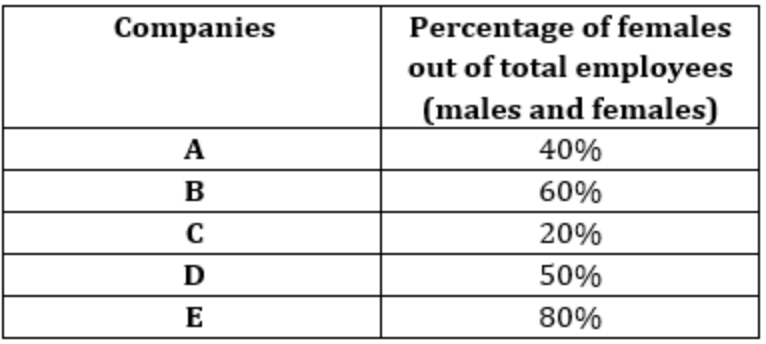
Using the data, find the ratio of the total number of male employees in companies C, B, and E to the total number of employees (both males and females) in companies A and B.