The line graph shows the total number of visitors (male + female) to four parks: A, B, C, and D over a certain period. The table lists the fraction of...
Question
The line graph shows the total number of visitors (male + female) to four parks: A, B, C, and D over a certain period. The table lists the fraction of males among the total visitors for each park.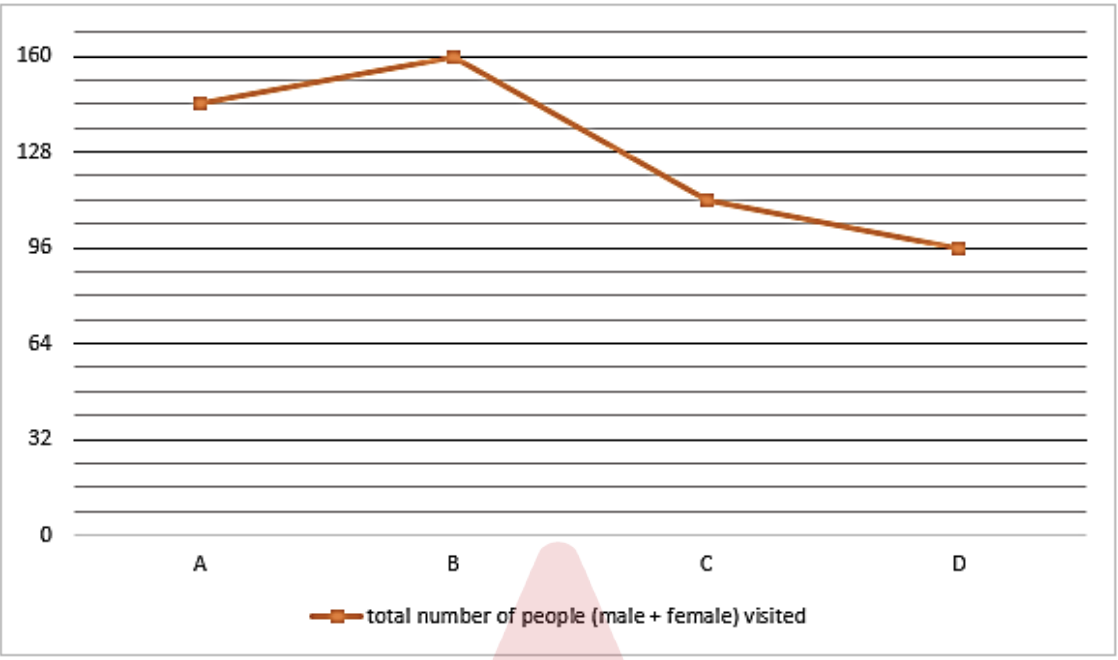
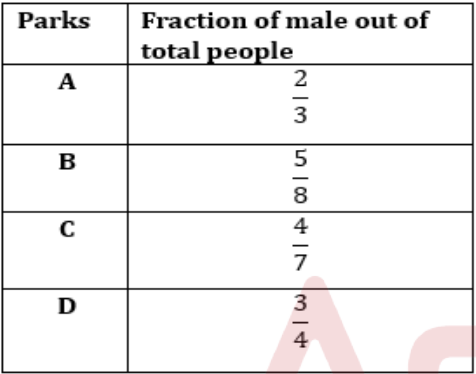
Using this data, calculate the difference between the average number of females who visited parks A, C, and D and the total number of males who visited park B.