The line graph below shows the total number of people (male + female) who visited four different parks (A, B, C, and D). The table provides the fracti...
Question
The line graph below shows the total number of people (male + female) who visited four different parks (A, B, C, and D). The table provides the fraction of males among the total visitors for each park.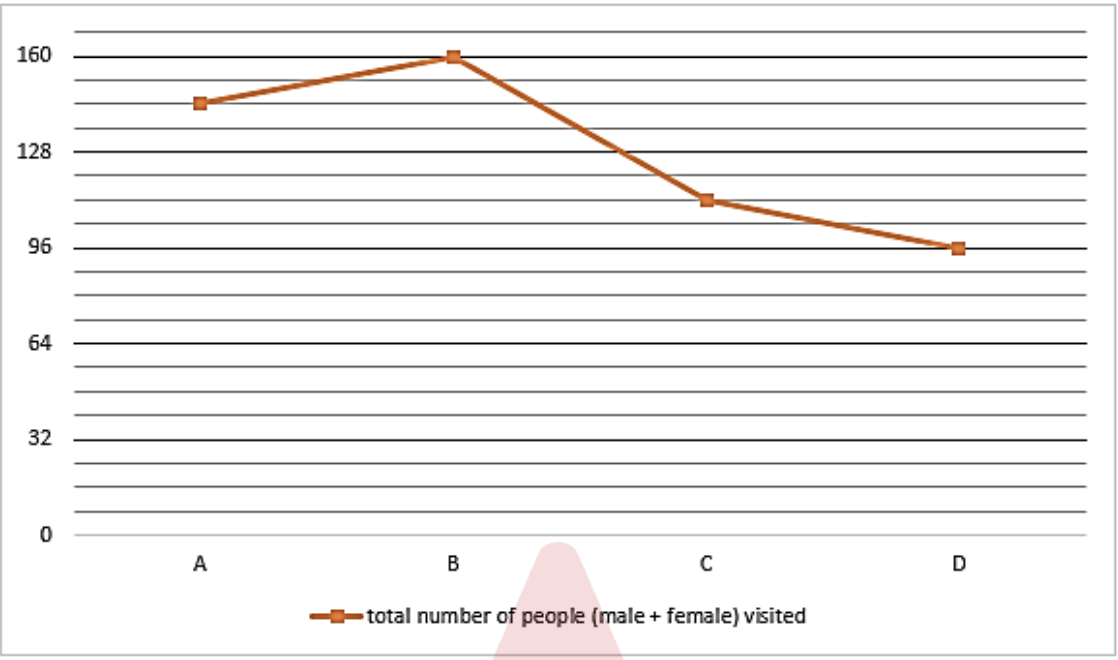
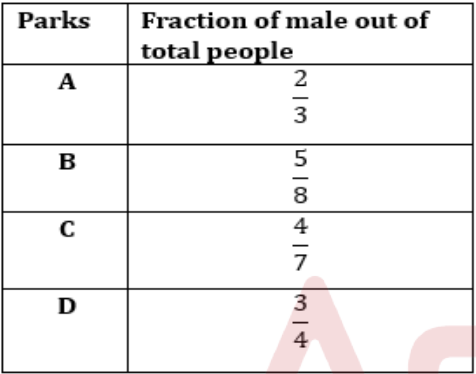
Using the data, find by what percent the total number of females who visited parks A and D together is more than the total number of females who visited park B.