Read the following pie chart and bar graph carefully and answer the questions given below. The bar graph shows total number of magazines and newspaper...
Question
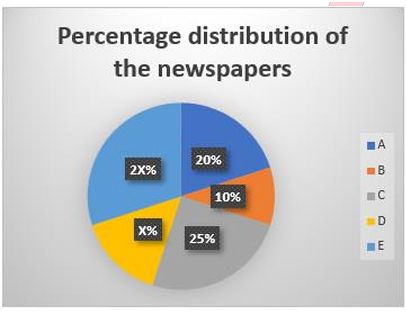
Read the following pie chart and bar graph carefully and answer the questions given below. The bar graph shows total number of magazines and newspapers published by five different publishers. The pie chart shows the percentage distribution of the newspapers published by these publishers.
Note: The total number of magazines published by A is 50.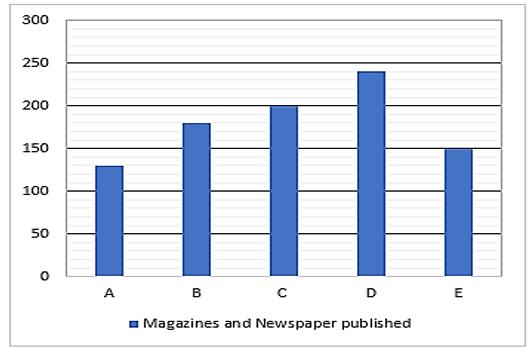
40% of the number of magazines published by A are sold and 20% of the number of newspapers published by A are unsold, then find the ratio of the total number of magazines and newspapers sold by A.