Read the following pie chart and bar graph carefully and answer the questions given below. The bar graph shows total number of magazines and newspaper...
Question
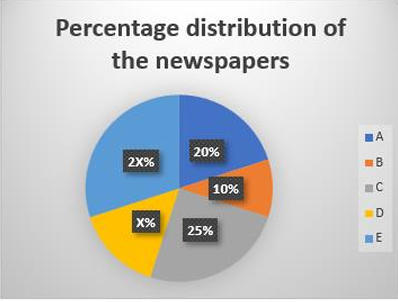
Read the following pie chart and bar graph carefully and answer the questions given below. The bar graph shows total number of magazines and newspapers published by five different publishers. The pie chart shows the percentage distribution of the newspapers published by these publishers.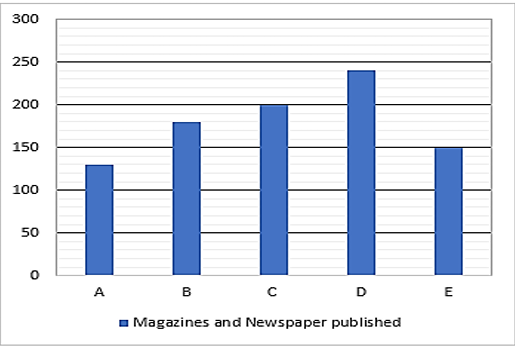
the total number of newspapers published by publisher G is 4 times more than that of E, while the total number of magazines published by G is 15 less than that of A, find the total number of newspapers and magazines published together by G.