The bar graph shows the total number of wired keyboards sold, and the table shows the percentage of wireless keyboards sold out of the total keyboards...
Question
The bar graph shows the total number of wired keyboards sold, and the table shows the percentage of wireless keyboards sold out of the total keyboards (wired + wireless) in five different shops.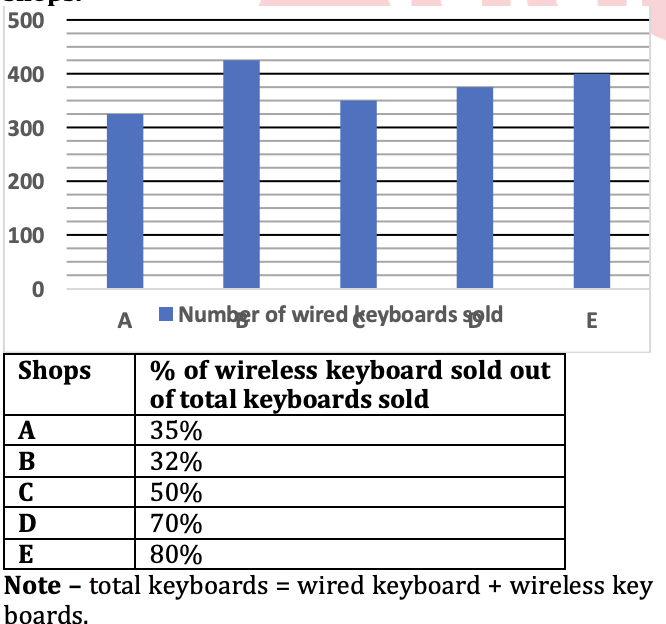
Find the ratio of wired keyboards sold by shops A and B together to the wireless keyboards sold by shop D.