The bar graph shows the total number of wired keyboards sold, and the table shows the percentage of wireless keyboards sold out of the total keyboards...
Question
The bar graph shows the total number of wired keyboards sold, and the table shows the percentage of wireless keyboards sold out of the total keyboards (wired + wireless) in five different shops.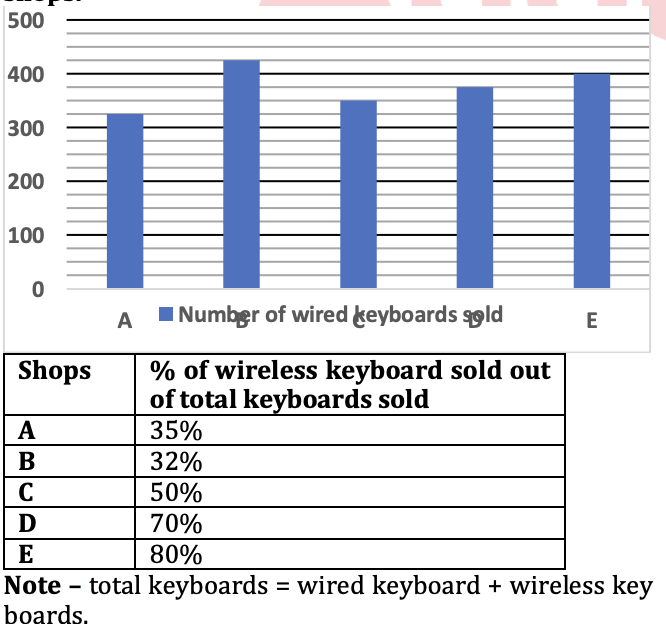
If shop F sold 25% more keyboards than the wired keyboards sold by shop E, and the wireless keyboards sold by shop F is 10% more than the total wireless keyboards sold by shop B, find the wired keyboards sold by shop F as a percentage of the average wireless keyboards sold by shops C and B.