The bar graph shows the total number of wired keyboards sold, and the table shows the percentage of wireless keyboards sold out of the total keyboards...
Question
The bar graph shows the total number of wired keyboards sold, and the table shows the percentage of wireless keyboards sold out of the total keyboards (wired + wireless) in five different shops.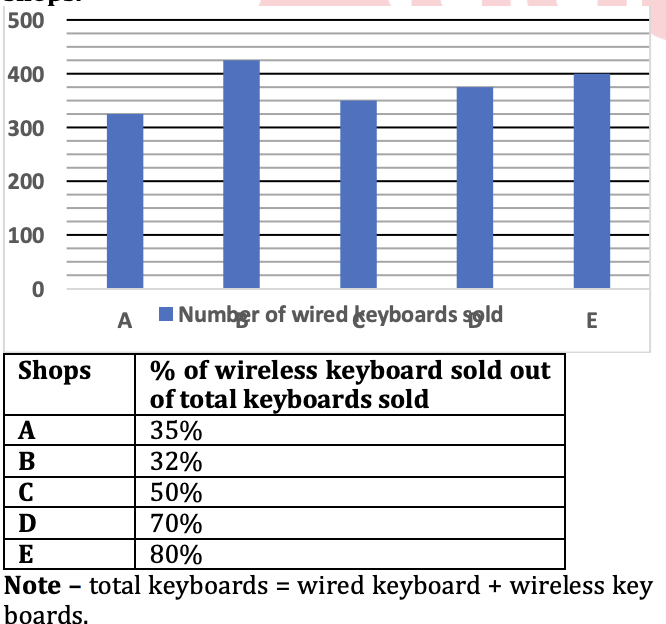
In shop D, out of the total keyboards sold, 445 are defective. If 80% of the defective keyboards are wireless, find the number of non-defective wired keyboards sold in shop D.