The line graph given below shows total number of people (male + female) visited four different parks (A, B, C and D) and table shows fraction of male ...
Question
The line graph given below shows total number of people (male + female)
visited four different parks (A, B, C and D) and table shows fraction of male out oftotal people visited
these four parks. Read the data carefully and answer the questions below.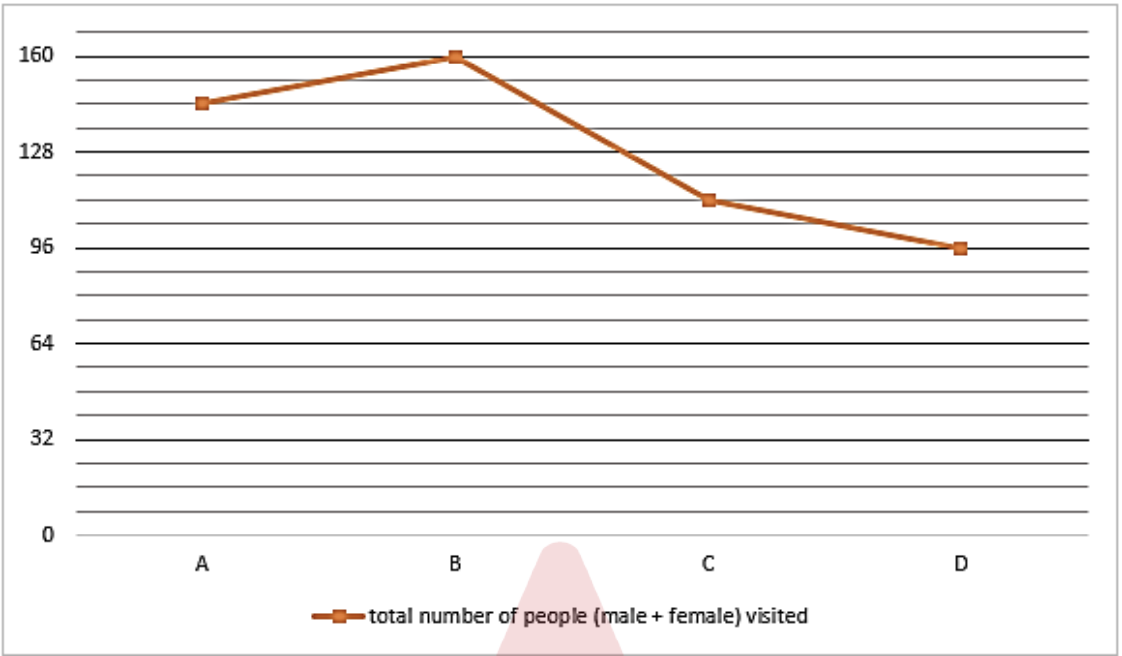
| Park | Fraction of Males |
|---|---|
| A | |
| B | |
| C | |
| D |
The ratio local and outside people visited park B is 7 : 1 respectively, while the ratio of total
local and outside females visited park B is 5 : 1 respectively. Find the ratio of outside to local males
visited park B.