Bar graph given below shows the total number of graduate and post graduate employees in five different companies. Table shows the difference between g...
Question
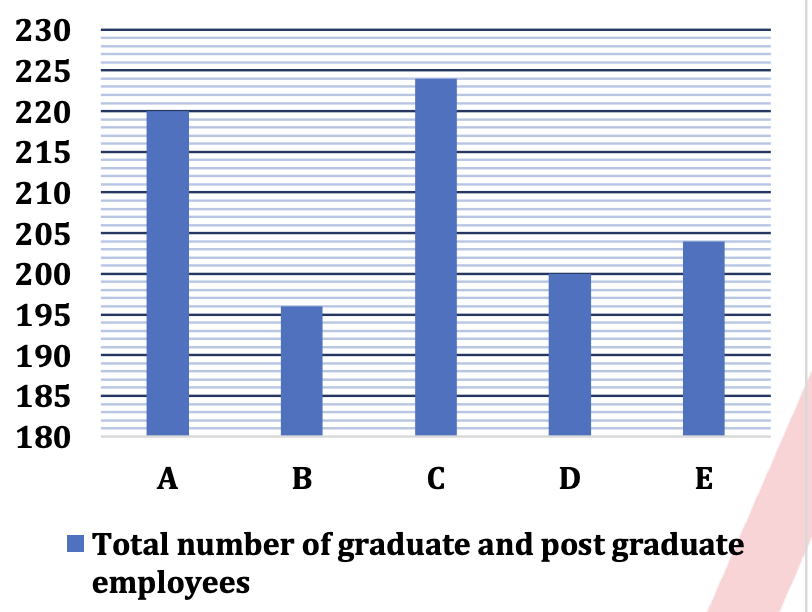
Bar graph given below shows the
total number of graduate and post graduate employees
in five different companies. Table shows the difference
between graduate and posts graduate employees.
| Company | Total Employees (Graduate + Postgraduate) | Difference (Graduate - Postgraduate) |
|---|---|---|
| A | 220 | 4 |
| B | 196 | 2 |
| C | 224 | 36 |
| D | 200 | 90 |
| E | 204 | 96 |
What is the difference between the average number of graduate employees in companies B and D and the average number of postgraduate employees in companies A and E?