The line graph below shows the total number of people (male + female) who visited four different parks (A, B, C, and D). The table provides the fracti...
Question
The line graph below shows the total number of people (male + female) who visited four different parks (A, B, C, and D). The table provides the fraction of males among the total visitors for each park.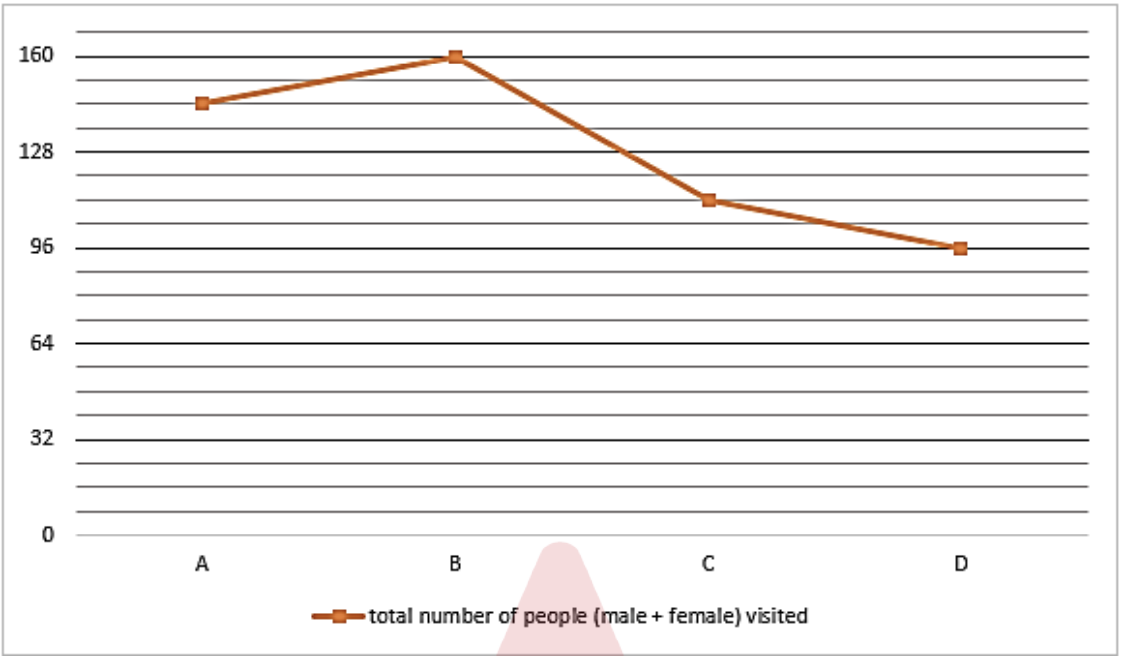
| Park | Fraction of Males |
|---|---|
| A | |
| B | |
| C | |
| D |
If the average number of females who visited parks A, B, and F is 60, find what percentage the total number of females who visited park F is of the total number of males who visited park A.