The line graph depicts the total quantities of items (P + Q) dispatched and the quantities of item Q dispatched from four warehouses (A, B, C, and D) ...
Question
The line graph depicts the total quantities of items (P + Q) dispatched and the quantities of item Q dispatched from four warehouses (A, B, C, and D) during the month of March.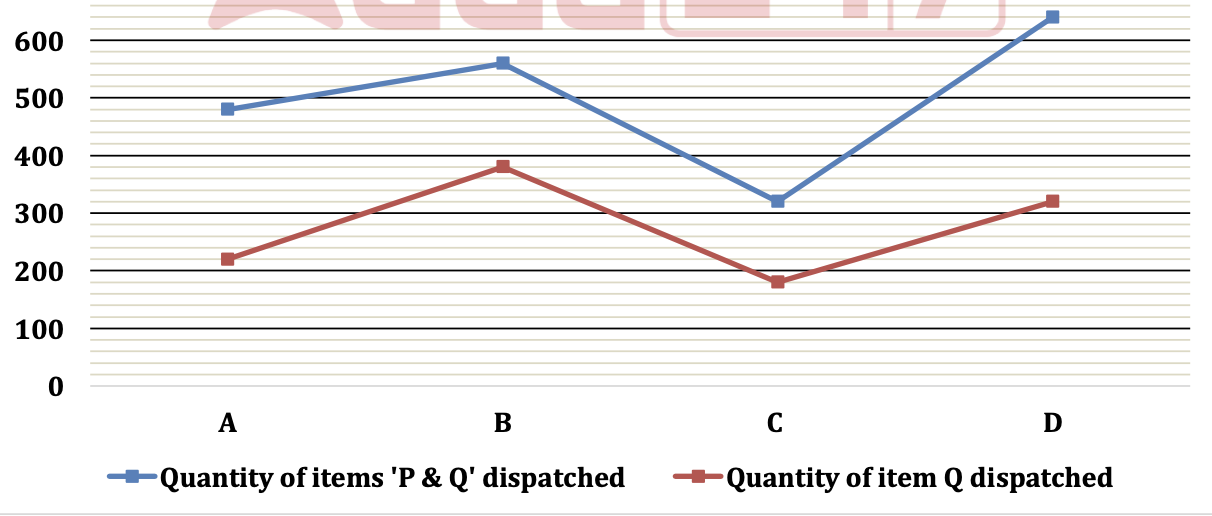
Using the data, find the ratio of the total number of item P dispatched from warehouses D and A combined to that from warehouses B and C combined.