The line graph shows the total quantity of items (P + Q) dispatched and the quantity of item Q dispatched from four warehouses A, B, C, and D in March...
Question
The line graph shows the total quantity of items (P + Q) dispatched and the quantity of item Q dispatched from four warehouses A, B, C, and D in March.
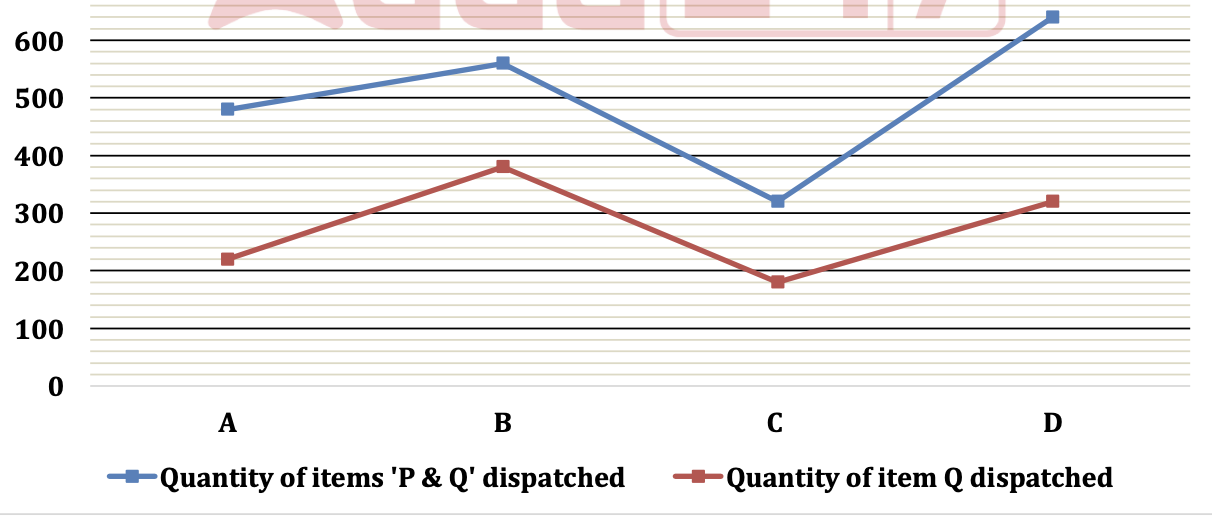
(Note: Quantity of item P = Total quantity (P + Q) - Quantity of item Q)
Find the total number of item Q dispatched from A is what percent of average number of item
P dispatched from B and D?