The line graph shows the total quantities of items (P + Q) dispatched and the quantities of item Q dispatched from four warehouses A, B, C, and D duri...
Question
The line graph shows the total quantities of items (P + Q) dispatched and the quantities of item Q dispatched from four warehouses A, B, C, and D during the month of March.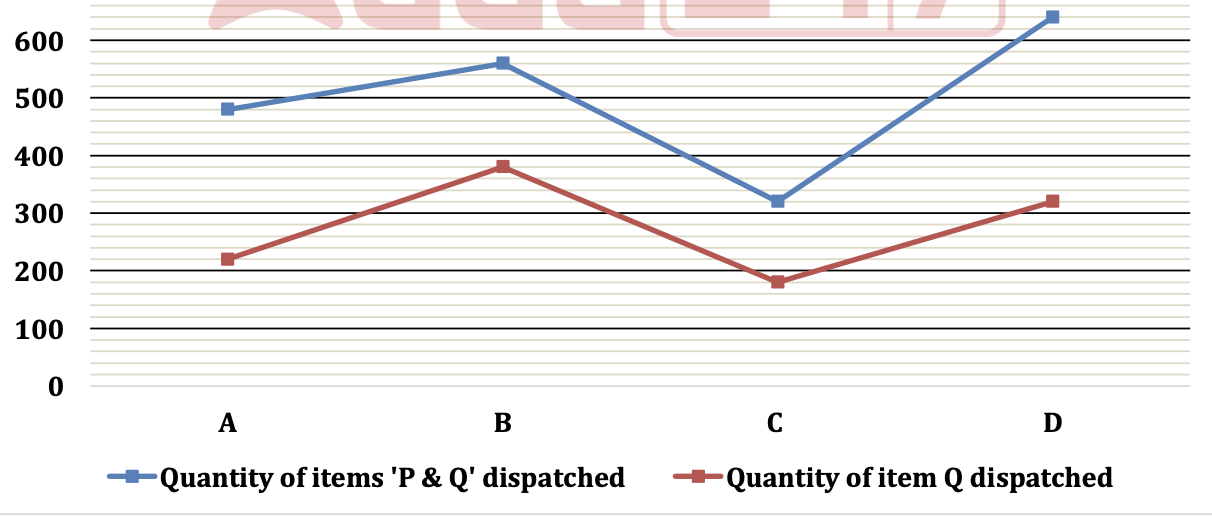
If the total quantity of item P dispatched from warehouse E is 40% more than the quantity of item Q dispatched from warehouse D, find how much more or less the quantity of item Q dispatched from warehouse B is compared to the quantity of item P dispatched from warehouse E.