The line graph shows the total quantity of items (P + Q) dispatched and the quantity of item Q dispatched from four warehouses (A, B, C, and D) during...
Question
The line graph shows the total quantity of items (P + Q) dispatched and the quantity of item Q dispatched from four warehouses (A, B, C, and D) during March.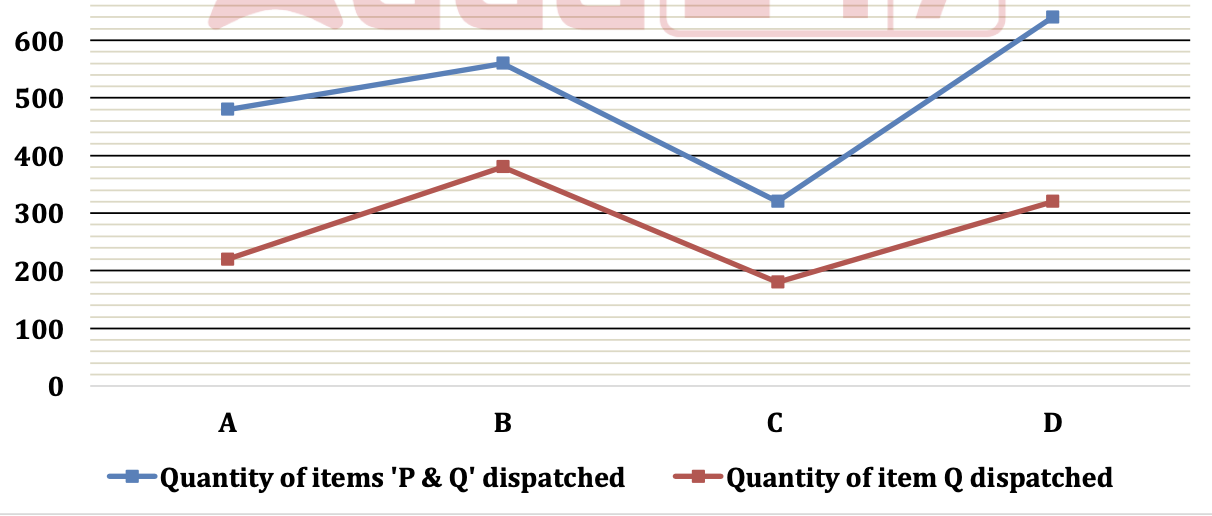
If the total quantity of items (P + Q) dispatched from warehouse B is 350 units and the quantity of item Q dispatched from warehouse B is 140 units, while the total quantity of items (P + Q) dispatched from warehouse C is 300 units and the quantity of item Q dispatched from warehouse C is 120 units, find approximately by what percentage the quantity of item Q dispatched from warehouse B is more or less than the quantity of item P dispatched from warehouse C.